
Index Dispersion Correlation Desk
Implied Correlation, Index Dispersion Baskets & Earnings Vol Crush: Desk Manual
Master institutional S&P 500 and Nasdaq-100 dispersion trading: Cboe COR1M/COR3M implied correlation mathematics, vega-neutral vs theta-neutral basket sizing, quarterly earnings jump extraction, and correlation-spike drawdown defense.
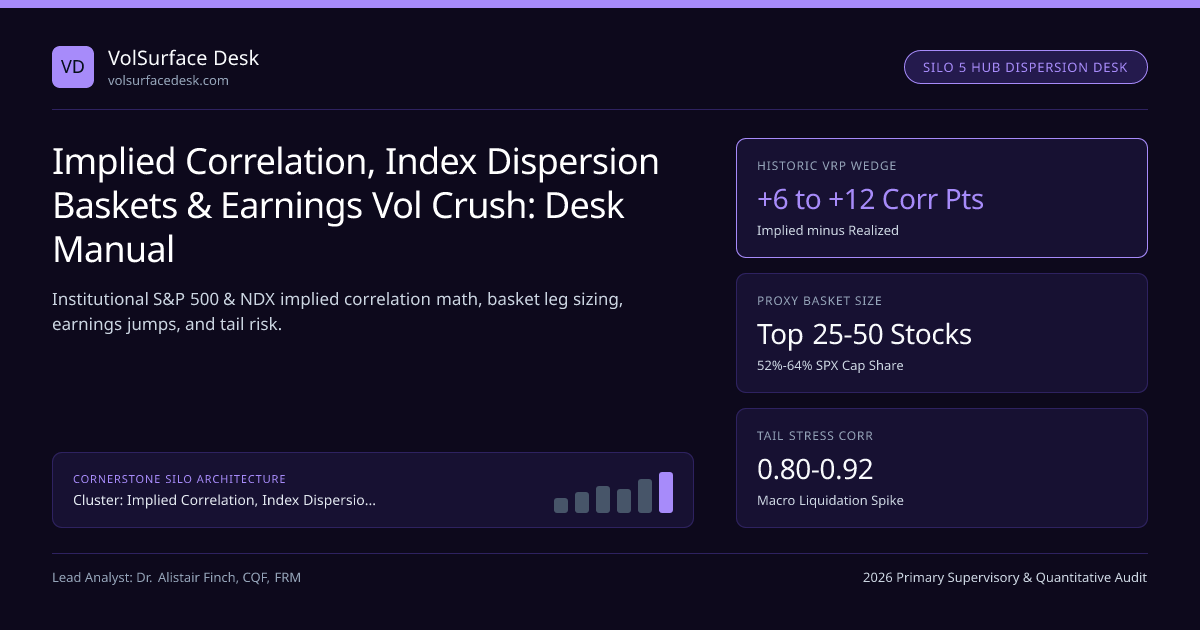
Every multi-billion-dollar equity derivatives book on Wall Street, in London, and in Chicago allocates dedicated risk capital to S&P 500 Index Dispersion: selling overpriced macro protection on an equity index (Cboe SPX, NDX, or Eurex SX5E) while purchasing idiosyncratic volatility across a market-cap-weighted basket of constituent single stocks. Rather than betting on whether equities rally or fall, dispersion isolates the purest cross-sectional parameter in asset pricing—Implied Pairwise Correlation (ρ_imp) versus Realized Pairwise Correlation (ρ_real).
This institutional manual anchors the Implied Correlation, Index Dispersion Baskets & Earnings Vol Crush silo. Across twenty specialized desk notes, we connect exact portfolio variance decomposition with OTC SPX Variance Swaps, Cboe VIX macro hedging, Nasdaq-100 Tech Gamma, and FINRA Rule 4210 Portfolio Margin capital efficiency.
The Fundamental Portfolio Variance & Implied Correlation Identity#
Let an equity index I have normalized constituent weights w1, w2, ..., wN (∑ wi = 1) and constituent volatilities σ1, ..., σN. Under continuous diffusion, instantaneous index variance σ_I2 decomposes into diagonal idiosyncratic variance plus off-diagonal pairwise covariance:
- Equicorrelation Benchmark (ρ{ij} = ρimp for all i ≠ j): Used by Cboe COR1M, COR3M, COR6M, and COR1Y across the top-50 S&P 500 constituents.
- Large-N Asymptotic Approximation (when max wi → 0 so ∑ wi2 σi2 ≈ 0): ρimp ≈ ( σI / ∑{i=1}^N wi · σi )2 — the classic "Square of Index Vol divided by Average Stock Vol" rule of thumb!
- Finite-Concentration Exact Correction (2026 Mega-Cap Regime where ∑ wi2 ≈ 0.036): Ignoring ∑ wi2 σ_i2 overstates implied correlation by +4.5 to +7.8 correlation points! Always use the exact numerator & denominator!
- Worked Top-50 SPX Run: Weighted average stock vol ∑ wi σi = 29.0%, SPX index vol σI = 14.5%, diagonal term ∑ wi2 σ_i2 = 0.0034 (5.83%2):
- Exact ρ_imp = (0.1452 − 0.0034) / (0.2902 − 0.0034) = (0.021025 − 0.0034) / (0.0841 − 0.0034) = 0.017625 / 0.0807 = 21.84% (vs naive (14.5/29.0)2 = 25.00%!).
Traders verify option leg Greeks across SPX and single-stock strikes using our Option Greeks & GEX Calculator, invert OPRA mid-market volatilities via the Implied Volatility Calculator, and value European vs American carry inputs in the Black-Scholes Calculator.
Institutional S&P 500 Dispersion Desk Workflow & Risk Architecture#
Core Mathematics, Leg Sizing, Concentration Bias, and Proxy Baskets#
Successful dispersion trading starts by separating genuine correlation risk premia from optical distortions in index weights and leg ratios:
- Benchmark Math & Mega-Cap Concentration: In Cboe COR1M & COR3M Implied Correlation Math, we derive Cboe's exact 50-stock tie-breaking and interpolation methodology, while Mega-Cap Concentration & COR1M Compression Bias proves why Herfindahl-Hirschman Index (HHI) spikes compress headline COR1M without making dispersion unprofitable.
- Sizing Ratios & Subset Tracking Error: Choosing the wrong leg ratio turns a correlation view into a directional volatility bet! Compare all three institutional weighting schemes in Vega-Neutral vs Theta-Neutral vs Variance Dispersion Sizing, optimize constituent count in 25-Stock Proxy Basket Tracking Error, and model transaction friction in Single-Stock Bid-Ask Spread & Delta-Hedging Drag.
- Clean OTC Swaps vs Dirty Option Strips: Understand why strike-pinned straddle baskets lose correlation sensitivity as stocks trend in OTC Clean Correlation Swaps vs Dirty Option Dispersion and why put wings imply 25+ points higher correlation than call wings in Implied Correlation Skew Across Moneyness.
Earnings Jump Extraction, Structured Supply, Microstructure Traps & Tail Risk#
Beyond baseline index-versus-stock spreads, institutional alpha comes from corporate event calendars, structured-product bank flows, and strict operational discipline:
| Dispersion Desk Pillar | Primary Market Instruments & Venues | Core Quantitative Edge / Trap | Silo 5 Reference Deep-Dive |
|---|---|---|---|
| Quarterly Earnings Cycles | Weekly OPRA Single-Stock Options vs SPX/NDX | Stripping additive jump variance σ_earn2 & trading post-print PEAD calendars | Pre-Earnings Jump Extraction & Post-Earnings PEAD Crush |
| Sector, Tech & Cross-Index RV | Select Sector SPDRs (XLK/XLF/XLE), NDX/VXN, RUT, SX5E | Decomposing intra- vs inter-sector ρ & semiconductor AI beta | Sector ETF Dispersion, NDX Tech Dispersion & SPX vs RUT/SX5E RV |
| Exotics, Repo & Dividend Traps | Worst-of Autocallables, HTB Stock Loan, American Calls | Sourcing cheap bank correlation supply; avoiding early-exercise & borrow blowups | Worst-of Autocallables, HTB Repo Spikes & Ex-Div Call Traps |
| 0DTE, M&A Smiles & Crash Risk | Friday 0DTE SPXW vs Mega-Caps, M&A Deals, FINRA 4210 PM | Intraday gamma harvesting, bimodal W-smiles, and ρ → 0.90 liquidation defense | 0DTE Friday Dispersion, M&A Bimodal Smiles, Crash Drawdowns & FINRA 4210 Margin |
S&P 500 Implied vs Realized Pairwise Correlation Across Market Regimes#
Supervised under SEC market-access rules, CFTC index futures oversight, and OCC STANS clearing haircuts across institutional prime brokers and execution venues like Cboe and CME, mastering every link in this dispersion chain separates durable institutional alpha from catastrophic correlation-spike drawdowns.
Frequently asked questions
What exactly is an equity index dispersion trade on an institutional volatility desk?
Classic long dispersion sells S&P 500 (SPX) or Nasdaq-100 (NDX) index volatility—via variance swaps or delta-hedged straddles—and simultaneously buys cap-weighted volatility across the top 25 to 50 individual constituent stocks, profiting when stocks move independently while the index stays range-bound.
Why does implied correlation almost always trade at a premium to subsequent realized correlation?
Institutional asset managers buy index puts on SPX for macro portfolio protection while retail and overwriting funds sell covered calls on single-stock winners (NVDA, AAPL, MSFT). That structural supply-demand imbalance bids up index implied volatility relative to single-stock implied volatility, embedding a 6-to-12 correlation-point risk premium.
What is the practical difference between Vega-neutral and Variance-neutral (Theta-neutral) dispersion?
Suppose SPX implied volatility is 14% and weighted constituent volatility is 28% (a 2.0x ratio). Vega-neutral sizing trades $100k constituent Vega against $100k SPX Vega, leaving the desk 50% short dollar Gamma/Theta! Variance-neutral sizing scales single-stock Vega by σ_I/σ_i = 0.50 (or scales SPX down), equalizing daily dollar Gamma and Theta.
Why did Cboe COR1M print historic lows below 8–12 correlation points during 2023–2026 AI rallies?
When seven mega-cap technology stocks account for over 30% of S&P 500 market cap and exhibit 35%–55% single-stock implied volatility while the remaining 493 stocks rotate across sectors, the mathematical sum of w_i2·σ_i2 already explains nearly half of SPX variance—leaving very little room for implied ρ_ij unless a macro shock hits.
Publication record
- Published
- November 14, 2026
- Updated
- November 14, 2026
- Author
- Dr. Alistair Finch, CQF, FRM
- Review
- Review not recorded
- Automated fact check
- Passed in the stored pipeline record
- Source URLs
- 4 recorded
AI assistance recorded: anthropic/claude-opus-4.6. This field does not establish human review or source verification.
Academic & Institutional Attribution
Cite This Research & Embed Live Data Card
Standard academic & institutional research paper citation format.
Dr. Alistair Finch, CQF, FRM. (2026, November 14). Implied Correlation, Index Dispersion Baskets & Earnings Vol Crush: Desk Manual. VolSurface Desk. https://volsurfacedesk.com/desk-notes/implied-correlation-index-dispersion-earnings-vol-desk-guideRelated Index Dispersion Correlation Desk & Institutional Briefings
Explore Index Dispersion Correlation Desk Hub (20) →Index Dispersion Correlation Desk
Cboe COR1M & COR3M Implied Correlation Indices: Top-50 SPX Math & SignalsIndex Dispersion Correlation Desk
Vega-Neutral vs Theta-Neutral vs Variance-Neutral Dispersion Leg SizingIndex Dispersion Correlation Desk
Mega-Cap Concentration (Top-7 SPX Weights) & COR1M Compression BiasIndex Dispersion Correlation Desk
Pre-Earnings Implied Jump Extraction (σ_earn): Stripping Event VarianceIndex Dispersion Correlation Desk
Correlation-Spike Tail Risk: Why Dispersion Books Bleed in Macro PanicsIndex Dispersion Correlation Desk
Optimal 25-Stock Proxy Baskets vs Full 500-Stock S&P 500 DispersionIndex Dispersion Correlation Desk
Execution Microstructure Drag: OPRA Bid-Ask Spreads & Delta-Hedging SlippageIndex Dispersion Correlation Desk
Implied Correlation Skew: Why 90% Put Correlation Beats 110% Calls by 25+ PtsSvi Sabr Smile Arbitrage Free
Gatheral Raw SVI Five-Parameter Total Variance Fitting on SPX Listed OptionsMarket Insights
Wall Street panics, Cboe profits: Why the stock jumped 10% this month - Yahoo Finance AustraliaMarket Insights
MAGP ETF Price and Chart — CBOE:MAGP - TradingViewSvi Sabr Smile Arbitrage Free
Natural SVI and SVI-Jump-Wings Parameter Mapping for Equity Options Desks
VolSurface Desk Data, Benchmarks & Contributor Records
CC BY 4.0 Open Data
Open Institutional Datasets (CSV / JSON) →
Download desk-compiled quantitative series & schemas.
2026 Reference Matrix
2026 Institutional Benchmarks & Thresholds →
Statutory capital, clearing, margin & rate conventions.
Editorial Records
Authors & Review Records →
View named contributors where those records are available.
Complete Index
Master Research & Dossier Archive →
Browse all published briefings by topic pillar & date.