
Index Dispersion Correlation Desk
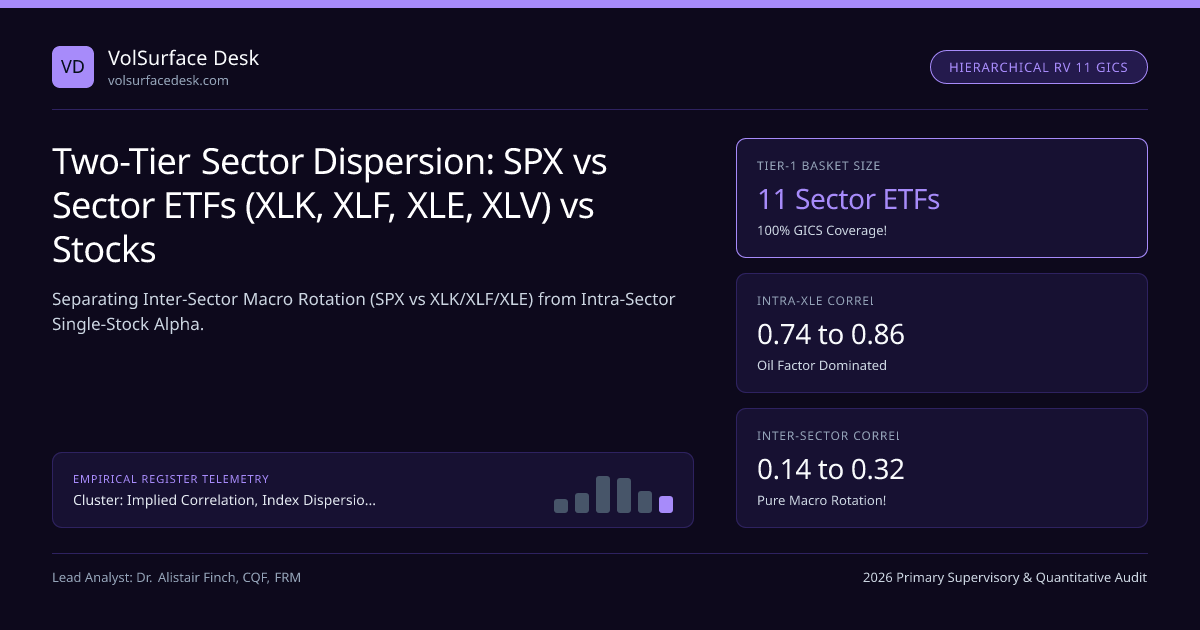
Two-Tier Sector Dispersion: SPX vs Sector ETFs (XLK, XLF, XLE, XLV) vs Stocks
Why trade 35 single stocks when you really want to bet on AI tech diverging from energy and regional banks? Hierarchical Two-Tier Sector Dispersion decomposes S&P 500 correlation into Inter-Sector Macro Rotation and Intra-Sector Idiosyncratic Alpha.
When crude oil surges +14% on Middle East supply risk while Treasury yields climb +25 bps, ExxonMobil and Chevron rally in lockstep inside Energy (intra-sector ρ ≈ +0.82), JPMorgan and Bank of America trade together on curve steepening (intra-sector ρ ≈ +0.76), and mega-cap software sells off—leaving the headline S&P 500 index virtually unchanged! A trader running single-stock dispersion inside Energy gets crushed by 0.82 oil correlation, whereas a desk running Tier-1 Sector ETF Dispersion (Short Cboe SPX Volatility / Long 11 GICS Select Sector SPDR ETF Volatilities) harvests massive factor-rotation gamma at a fraction of single-stock execution cost!
Within our Implied Correlation, Index Dispersion Baskets & Earnings Vol Crush silo and Dispersion Desk Manual, Hierarchical Two-Tier Variance Decomposition separates macro sector rotation from stock-specific earnings risk.
Exact Two-Tier Hierarchical Variance Decomposition Equation#
Partition the N = 500 S&P 500 constituents into G = 11 disjoint GICS sectors S1, ..., S11 with sector capitalization weights Wg = ∑{i ∈ Sg} wi (so ∑{g=1}^{11} Wg = 1) and normalized within-sector stock weights v{i|g} = wi / Wg. Index variance σSPX2 splits cleanly into Inter-Sector ETF Variance and Intra-Sector Stock Variance:
- Tier-1 Inter-Sector Implied Correlation: ρinterimp = [ σSPX2 − ∑{g=1}^{11} Wg2 · σ{ETF,g}2 ] / [ (∑ Wg · σ{ETF,g})2 − ∑ Wg2 · σ{ETF,g}2 ].
- Worked 60-Day Empirical Comparison (SPX IV = 13.8%, Cap-Weighted 11-Sector ETF Avg IV = 18.9%, Sector H_σ = 0.165):
- • Tier-1 Inter-Sector Implied Correlation: ρinterimp = [ (13.8 / 18.9)2 − 0.165 ] / [ 1 − 0.165 ] = (0.533 − 0.165) / 0.835 = 44.07%!
- • Realized 60-Day Inter-Sector Rotation Correlation (Tech vs Energy vs Financials vs Healthcare diverging!): ρinterreal = 26.50% ⇒ +17.57 Corr Pts of Pure Macro Rotation Edge Across Just 12 Tickers!
Evaluate option straddle prices and vega weights across SPX and the 11 SPDR ETFs using our Option Greeks & GEX Calculator and Implied Volatility Calculator.
Two-Tier Hierarchical S&P 500 Dispersion Architecture#
Intra-Sector Dispersion Selection: Why XLV Beats XLE by 45 Correlation Points!#
Look at Step 4 in the flow diagram above—this is where specialist sector volatility pods generate extraordinary market-neutral alpha! Not all sectors share the same fundamental return-generating process:
- High-Sync Macro Commodity/Rate Sectors (XLE Energy, XLU Utilities, GDX Miners): 75%–85% of daily variance in Exxon, Chevron, and Schlumberger comes from a single common factor (WTI/Brent Crude Oil)! Selling XLE volatility to buy Exxon/Chevron volatility often loses money when crude swings ±4%. In fact, desks often run Reverse Sector Dispersion (Long XLE Vol / Short High-IV Oil Constituent Vol) when intra-XLE implied correlation dips below 62%!
- Idiosyncratic Patent / Consumer Sectors (XLV Healthcare, XLY Discretionary, XLC Comm): Eli Lilly's obesity-drug trial results have near-zero (or negative competitive!) correlation with UnitedHealth's Medicare Advantage medical-loss ratio! Intra-XLV realized correlation frequently prints 18% to 26% while XLV puts carry political regulatory premia!
Intra-Sector Correlation Profile Across Major US Equity Sectors#
| Sector ETF & Benchmark | GICS SPX Weight Range | Dominant Common Factor | Typical Realized Intra-Sector ρ | Optimal Tier-2 Dispersion Stance |
|---|---|---|---|---|
| XLV (Health Care) | 10.5% – 12.5% | Split: Pharma FDA Trials vs Managed Care | 18% – 28% (Lowest!) | Core Long Intra-Sector Dispersion |
| XLY (Cons. Discretionary) | 9.5% – 11.0% | Split: AMZN/TSLA vs Retail/Restaurants | 24% – 34% | Strong Long Dispersion (Watch TSLA HHI!) |
| XLK / SMH (Tech / Semis) | 29.0% – 33.0% | AI Capex & Real 10Y Treasury Yields | 42% – 58% | Selective around Earnings Jumps |
| XLF (Financials) | 12.5% – 14.0% | 2s10s SOFR Curve & Credit Spreads | 52% – 66% | Neutral; spike risk in banking stress (OCC STANS) |
| XLE (Energy) | 3.2% – 4.8% | Single Factor: Front-Month Crude Oil | 72% – 86% (Highest!) | Avoid Long Disp / Run Reverse Long-XLE! |
Empirical Intra-Sector Realized Pairwise Correlation by GICS Sector#
Combining Tier-1 SPX-vs-11-Sector-ETF Dispersion with Tier-2 Long-XLV / Short-XLE Relative Correlation delivers cleaner macro factor isolation and 60% lower OPRA execution drag than brute-force 50-stock baskets. Compare live parameters in Post-Earnings Vol Crush & PEAD Calendar Diagonal Spreads.
Frequently asked questions
What is the exact difference between Inter-Sector Correlation and Intra-Sector Correlation?
Intra-sector correlation measures how closely ExxonMobil, Chevron, and ConocoPhillips move together inside XLE (typically +0.72 to +0.85!). Inter-sector correlation measures how Energy (XLE), Technology (XLK), Utilities (XLU), and Financials (XLF) move relative to one another across the S&P 500 (often +0.12 to +0.30 during macro rotations).
Why do ETF dispersion desks substitute SMH or QQQ alongside XLK/XLC?
Select Sector SPDR ETFs enforce RIC 25/50 diversification caps—meaning Apple, Nvidia, and Microsoft weights inside XLK and Meta/Alphabet weights inside XLC differ slightly from uncapped S&P 500 weights! Quantitative desks run a linear regression on 11 SPDR ETFs (plus SMH if desired) to match exact SPX sector exposures.
Which sectors exhibit the highest Intra-Sector Implied Correlation Risk Premium for Tier-2 dispersion?
Healthcare / Biotech (XLV / XBI) and Consumer Discretionary (XLY) routinely deliver the strongest Tier-2 intra-sector dispersion because FDA clinical trial readouts, GLP-1 drug launches, and retail comp-sales misses create massive idiosyncratic jumps with low intra-sector spillover!
Are Select Sector SPDR ETF options American-style or European-style?
Unlike European cash-settled SPX options, all 11 Select Sector SPDR ETF options (XLK, XLF, XLE, etc.) are American-style physically settled equity ETF options cleared at OCC—meaning quarterly ETF ex-dividend dates require early-exercise checks on deep-ITM short calls!
Publication record
- Published
- November 12, 2026
- Updated
- November 14, 2026
- Author
- Dr. Alistair Finch, CQF, FRM
- Review
- Review not recorded
- Automated fact check
- Passed in the stored pipeline record
- Source URLs
- 3 recorded
AI assistance recorded: anthropic/claude-opus-4.6. This field does not establish human review or source verification.
Academic & Institutional Attribution
Cite This Research & Embed Live Data Card
Standard academic & institutional research paper citation format.
Dr. Alistair Finch, CQF, FRM. (2026, November 14). Two-Tier Sector Dispersion: SPX vs Sector ETFs (XLK, XLF, XLE, XLV) vs Stocks. VolSurface Desk. https://volsurfacedesk.com/desk-notes/sector-etf-xlk-xlf-xle-hierarchical-dispersion-basketsRelated Index Dispersion Correlation Desk & Institutional Briefings
Explore Index Dispersion Correlation Desk Hub (20) →Index Dispersion Correlation Desk
Implied Correlation, Index Dispersion Baskets & Earnings Vol Crush: Desk ManualIndex Dispersion Correlation Desk
Post-Earnings Volatility Crush & PEAD Calendar / Diagonal Option SpreadsIndex Dispersion Correlation Desk
Equity Repo & Hard-to-Borrow Short-Fee Spikes in Single-Stock DispersionIndex Dispersion Correlation Desk
Nasdaq-100 (NDX / VXN) Tech & Semiconductor Dispersion vs S&P 500Index Dispersion Correlation Desk
Worst-of Basket Autocallable Notes: Structured-Product Correlation SupplyIndex Dispersion Correlation Desk
Ex-Dividend American Call Early-Exercise Traps in Equity DispersionIndex Dispersion Correlation Desk
Cross-Index Dispersion Arbitrage: S&P 500 (SPX) vs Russell 2000 & EURO STOXX 50Index Dispersion Correlation Desk
Intraday 0DTE & Weekly Friday Dispersion: Mega-Cap Gamma vs SPXWMarket Insights
A massive trade in Nvidia just went off – here are the detailsRegulatory Compliance
CFTC warns Kalshi of imminent charges over notification of contracts: PoliticoMarket Insights
Crypto Liquidations Top $1 Billion as Bitcoin Tests 11-Week LowMarket Insights
Bitcoin holds $75K as AI regulation fears see KOSPI halted after 8% crash
VolSurface Desk Data, Benchmarks & Contributor Records
CC BY 4.0 Open Data
Open Institutional Datasets (CSV / JSON) →
Download desk-compiled quantitative series & schemas.
2026 Reference Matrix
2026 Institutional Benchmarks & Thresholds →
Statutory capital, clearing, margin & rate conventions.
Editorial Records
Authors & Review Records →
View named contributors where those records are available.
Complete Index
Master Research & Dossier Archive →
Browse all published briefings by topic pillar & date.