
Index Dispersion Correlation Desk
Correlation-Spike Tail Risk: Why Dispersion Books Bleed in Macro Panics
In calm markets, selling S&P 500 correlation feels like printing steady Sharpe-2.5 carry. Then ayen-carry unwind or liquidity shock hits: pairwise correlation leaps from 0.18 to 0.88 in four hours. Here is the anatomy and defense of a dispersion blowup.
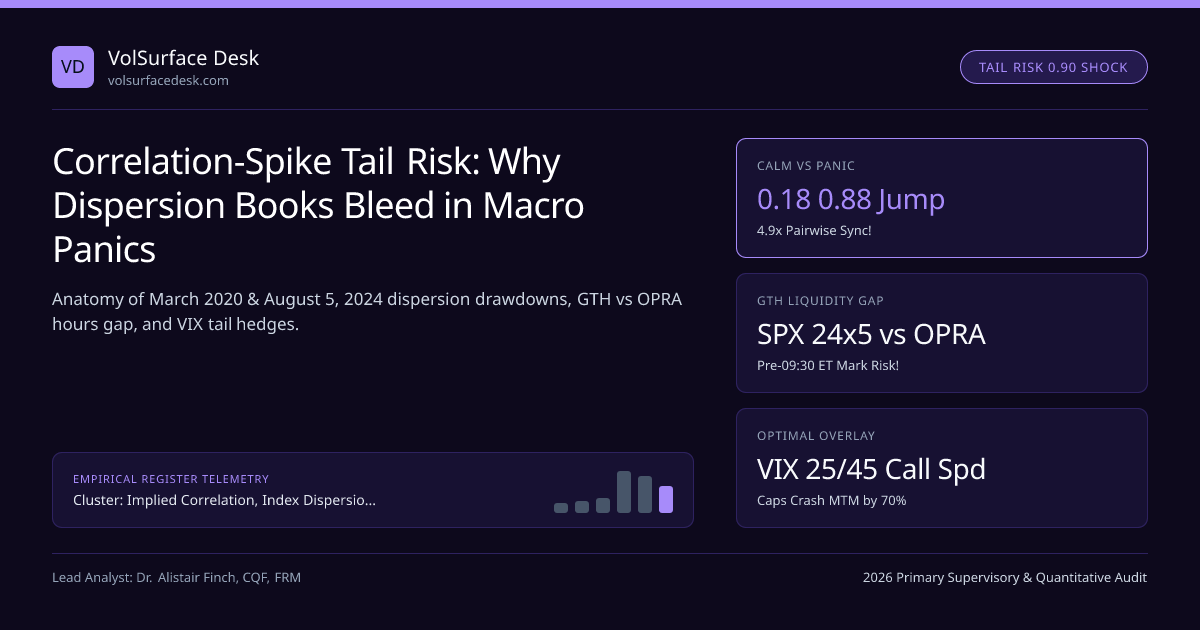
For thirty-four consecutive months, a poorly constructed 1:1 Vega-neutral S&P 500 Dispersion book can generate smooth, deceptive monthly profits—lulling risk managers into granting 5x notional leverage. Then comes a morning like March 16, 2020 or August 5, 2024 (examined by the Bank for International Settlements in its Q3 2024 Quarterly Review): global macro books hit risk limits, index futures cascade lower, realized pairwise correlation leaps from 0.16 to 0.88, and 18 months of dispersion carry evaporate before lunch!
Within our Implied Correlation, Index Dispersion Baskets & Earnings Vol Crush silo and Dispersion Desk Manual, dissecting the exact mathematical and microstructure mechanics of a Correlation-Spike Drawdown is mandatory survival training for every institutional volatility PM.
The Quadratic Double Whammy: Realized Gamma Loss + Implied Correlation Re-Pricing#
Suppose a desk enters a 90-day OTC variance dispersion swap (short $100,000 Vega of SPX Variance at KI = 14.0%, long $100,000 Vega of Top-35 constituent variance at KS = 28.0%, implying ρ0 ≈ 25%). Recall that Variance Notional is **Nvar = Nvega / (2 · Kvol)**:
- Short SPX Variance Notional: N_var,I = $100,000 / (2 × 14.0) = −$3,571 per variance point!
- Long Stock Basket Variance Notional: N_var,S = $100,000 / (2 × 28.0) = +$1,786 per variance point (exactly HALF of SPX!).
Now watch what happens when a sudden −5.5% macro liquidation gap hits on Day 10 and implied correlation jumps from 25% to 68%:
Quantitative Pricing Model: Dispersion Correlation-Spike Tail Risk & Crash Hedging#
- Let t/T ≈ 0.11 (80 days remaining). Every single stock drops −5.5% ± 1.5% in lockstep (ρreal ≈ 0.90! Daily rI2 = 30.25 bps2, r_S2 ≈ 32.50 bps2):
- 1) Realized 1-Day Cash Gamma Shock: SPX variance jump costs −$3,571 × (252/63 × 30.25) = −$432k, while Stock leg pays +$1,786 × (252/63 × 32.50) = +$232k ⇒ −$200,000 Instant Realized Loss!
- 2) Remaining 80-Day Implied Correlation Explosion (Stock Vol rises 28% → 38% [+10v], but ρ_imp jumps 0.25 → 0.68 so SPX Vol jumps 14% → 0.825×38% = 31.35% [+17.35v!]):
- Stock Forward MTM = +$1,786 × 0.89 × (382 − 282) = +$1,049,000; SPX Short Forward MTM = −$3,571 × 0.89 × (31.352 − 14.02) = −$2,500,000!
- Total 1-Morning Dispersion Drawdown = −$200k + ($1,049k − $2,500k) = −$1,651,000 (−16.5× Vega Notional in 4 hours!!).
Stress-test any SPX versus constituent Gamma/Vega shock before putting on risk using our Option Greeks & GEX Calculator and Black-Scholes Calculator.
Anatomy of the August 5, 2024 Pre-Market Dispersion Margin Squeeze#
Four Institutional Defenses Against Correlation-Spike Tail Risk#
Top-decile volatility funds survived both March 2020 and August 5, 2024 profitably by enforcing four non-negotiable structural guardrails:
| Tail-Defense Mechanism | Exact Implementation Structure | Annualized Carry Cost | Crisis Payoff / Protection Profile |
|---|---|---|---|
| 1. √ρ / Gamma-Neutral Sizing | Cap short SPX Vega at 0.50x–0.65x of long single-stock Vega (Sizing Guide) | +50 bps Theta drag in dead markets | Eliminates net short $Γ; cuts 1-day MTM drawdown by 65%–80%! |
| 2. OTM Cboe VIX Call Spreads | Allocate 15% of monthly dispersion carry to 60-day Cboe VIX 25/45 or 30/55 call verticals (VVIX Convexity) | ~18–25 bps/month | Settles during GTH & RTH; paid 11x-to-14x on Aug 5, 2024 morning! |
| 3. 2.5x Capped SPX Short Leg? | TRAP WARNING! Single-stock variance is capped at 2.5x while index variance is UNCAPPED! Instead, use Up-Variance Corridors | Reduces received SPX strike by 1.8v | Shuts off short SPX variance accrual automatically if SPX drops > 8% |
| 4. 2.5x Unencumbered Cash Buffer | Hold excess T-bill collateral above OCC STANS & FINRA 4210 PM minimums | Zero (earns SOFR T-bill yield!) | Prevents forced liquidation at 09:31 ET before OPRA liquidity normalizes at 10:15 ET! |
Historical S&P 500 Realized Pairwise Correlation Spikes in Crisis Windows#
Notice what happened twelve trading days after August 5, 2024: desks that held VIX call spreads and excess cash monetized their VIX wings at 09:45 ET and DOUBLED their short correlation book at COR3M = 48, generating their best annual return in a decade! Compare live parameters in Optimal 25-Stock Proxy Basket SPX Dispersion Tracking Error.
Frequently asked questions
What happened to institutional dispersion books on Monday morning August 5, 2024?
Following the Bank of Japan rate hike and USD/JPY carry unwind, S&P 500 futures fell -4.2% pre-open and Cboe VIX surged from 23 to 65.73 at 08:35 ET! Because SPX index options trade Nearly 24/5 on Cboe Global Trading Hours while single-stock OPRA options CANNOT trade until 09:30 ET, desks saw huge pre-market short SPX mark-to-market losses before their long single-stock calls/puts even opened!
Why did single-stock implied volatilities lag SPX implied volatility during the March 2020 and August 2024 panics?
During panic liquidations, institutions urgently buy SPX and VIX options first because index liquidity is 10x deeper than individual equities, while retail call buyers vanish from single-stock upside chains and OPRA market makers widen single-stock bid-ask spreads! Thus the short leg gets squeezed hardest while the long leg suffers liquidity haircuts.
How does an OTC Corridor or Conditional Downside Variance Swap protect a dispersion book?
Instead of selling uncapped SPX variance against single-stock variance, a desk sells Up-Variance (corridor active only when SPX > 92% of initial spot) or buys a 25-delta SPX put-corridor variance leg—automatically switching off the short index variance obligation if the S&P 500 enters a systemic crash!
Why is Cboe VVIX / VIX call convexity the cleanest macro hedge for a dispersion portfolio?
VIX is mathematically driven by SPX variance—which equals ρ · σ̄2! When a correlation shock hits, VIX jumps BOTH because σ̄ rises AND because ρ triples! An OTM VIX 25/45 call vertical costs ~15–20 bps/month of book NAV yet pays 8x-to-15x precisely during a ρ → 0.85 correlation spike.
Publication record
- Published
- November 13, 2026
- Updated
- November 14, 2026
- Author
- Dr. Alistair Finch, CQF, FRM
- Review
- Review not recorded
- Automated fact check
- Passed in the stored pipeline record
- Source URLs
- 3 recorded
AI assistance recorded: anthropic/claude-opus-4.6. This field does not establish human review or source verification.
Academic & Institutional Attribution
Cite This Research & Embed Live Data Card
Standard academic & institutional research paper citation format.
Dr. Alistair Finch, CQF, FRM. (2026, November 14). Correlation-Spike Tail Risk: Why Dispersion Books Bleed in Macro Panics. VolSurface Desk. https://volsurfacedesk.com/desk-notes/macro-liquidation-correlation-spike-dispersion-drawdownsRelated Index Dispersion Correlation Desk & Institutional Briefings
Explore Index Dispersion Correlation Desk Hub (20) →Index Dispersion Correlation Desk
Implied Correlation, Index Dispersion Baskets & Earnings Vol Crush: Desk ManualIndex Dispersion Correlation Desk
Optimal 25-Stock Proxy Baskets vs Full 500-Stock S&P 500 DispersionIndex Dispersion Correlation Desk
Execution Microstructure Drag: OPRA Bid-Ask Spreads & Delta-Hedging SlippageIndex Dispersion Correlation Desk
Implied Correlation Skew: Why 90% Put Correlation Beats 110% Calls by 25+ PtsIndex Dispersion Correlation Desk
OTC Clean Correlation Swaps vs Option-Strip "Dirty" Dispersion MechanicsIndex Dispersion Correlation Desk
Two-Tier Sector Dispersion: SPX vs Sector ETFs (XLK, XLF, XLE, XLV) vs StocksIndex Dispersion Correlation Desk
Post-Earnings Volatility Crush & PEAD Calendar / Diagonal Option SpreadsIndex Dispersion Correlation Desk
Equity Repo & Hard-to-Borrow Short-Fee Spikes in Single-Stock DispersionMarket Insights
Top Wall Street analysts are bullish on these 3 stocks for strong long-term growth potentialMarket Insights
Top Wall Street analysts are confident about these 3 stocks for the long haulMarket Insights
Top Wall Street analysts are bullish on the growth potential of these 3 stocksMarket Insights
Equity Dispersion Trade Risks a Blowup, Hedge Fund CEO Warns - Bloomberg.com
VolSurface Desk Data, Benchmarks & Contributor Records
CC BY 4.0 Open Data
Open Institutional Datasets (CSV / JSON) →
Download desk-compiled quantitative series & schemas.
2026 Reference Matrix
2026 Institutional Benchmarks & Thresholds →
Statutory capital, clearing, margin & rate conventions.
Editorial Records
Authors & Review Records →
View named contributors where those records are available.
Complete Index
Master Research & Dossier Archive →
Browse all published briefings by topic pillar & date.