
Index Dispersion Correlation Desk
Worst-of Basket Autocallable Notes: Structured-Product Correlation Supply
Why would a major Wall Street or European investment bank eagerly pay hedge funds +4 correlation points of edge on a custom 15-stock dispersion swap? Because $120B+ of retail "Worst-of-Three" Autocallable notes left the bank dangerously LONG correlation!
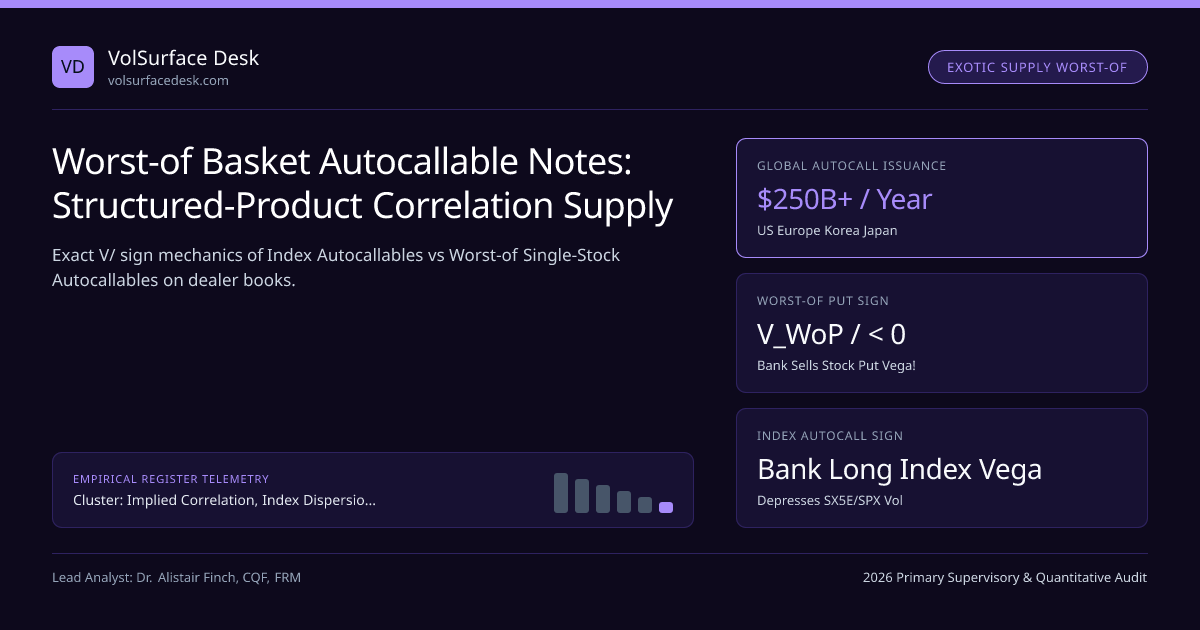
Every institutional volatility trader tracks Structured Retail Product Issuance (SEC shelf prospectuses in the US, ESMA PRIIPs filings in Europe, and ELS filings in Korea/Japan) because $250+ Billion per year of Autocallable Notes leaves exotic bank desks holding massive, one-way volatility and correlation imbalances! Even better, Index Autocallables and Worst-of Single-Stock Autocallables push the Implied Correlation surface in opposite, complementary directions—creating custom bank "recycling" opportunities for hedge funds who know the exact cross-derivative calculus.
Within our Implied Correlation, Index Dispersion Baskets & Earnings Vol Crush silo and Dispersion Desk Manual, let us derive the exact Correlation Greek (Cega = ∂V / ∂ρ) and Cross-Gamma (∂2V / ∂Si ∂Sj) of Worst-of baskets with zero hand-waving.
Exact Mathematical Sign Proof: ∂V / ∂ρ on Worst-of Puts vs Index Autocalls#
Consider K normalized stock return ratios Ri = Si(T) / Si(0) for i = 1, ..., K (commonly K = 3, e.g., NVDA, AAPL, TSLA). Inside a Worst-of Autocallable Note, the retail investor receives high coupons funded by **selling a Down-and-In Put on the Worst-Performing Stock WT = min(R1, ..., RK) at barrier B (typically 50%–65% of initial spot). Because min(x1, ..., xK) is a concave function**, Slepian's Lemma in Gaussian/copula probability proves a rock-solid theorem:
- Verify with a 3-Stock Basket where each stock has standalone crash probability p = P(R_i < 0.60) = 12.0%:
- • Perfect Lockstep Correlation (ρ = 1.00): All 3 stocks move identically ⇒ P(min R_i < 0.60) = 12.0% (1.00x standalone put price!).
- • Moderate Tech Correlation (ρ = 0.40): Copula knock-in probability rises to 24.8% (2.07x standalone put price!).
- • Zero Independence (ρ = 0.00): P(min R_i < 0.60) = 1 − (1 − 0.12)3 = 1 − 0.6815 = 31.85% (2.65x standalone put price ⇒ Huge retail coupon!).
- Dealer Book Consequence: Retail SELLS the Worst-of Put ⇒ Issuing Bank is LONG the Worst-of Put ⇒ Bank has ∂Book/∂ρ < 0 (SHORT Correlation!) AND Long Single-Stock Downside Vega + Cross-Gamma!
Model standalone constituent puts and Vanna & Charm barrier sensitivities around 60% knock-in zones using our Black-Scholes Calculator and Option Greeks & GEX Calculator.
How Retail Autocallables Create Two Distinct Hedge-Fund Recycling Trades#

"Worst-Of Laggard Switching" Cross-Gamma & Custom Bank Recycling Baskets!#
Watch the wild dynamic inside Channel A (US Worst-of Tech Autocallables)—over $80 Billion issued across US private-wealth platforms on popular 3-stock trios like NVDA / TSLA / AAPL or AMD / META / AMZN:
- Why Long Dispersion Pods Love BankWorst-Of Recycling: Because the issuing bank has ∂Book/∂ρ < 0 (the bank loses money if ρ spikes toward 1.00 because its long Worst-of Put collapses in value toward a single-stock put!), the bank urgently wants to BUY Correlation (Sell Dispersion) on that exact basket of 10–15 popular autocallable stocks! Exotic desks therefore show hedge funds discounted custom OTC Dispersion Swaps (offering constituent variance 1.5–2.5 vol points cheaper and buying index/basket variance richer) to clear their Basel FRTB Residual Risk Add-On (RRAO)!
- Laggard Vega Concentration: If NVDA rallies +40% while TSLA drops −25%, TSLA becomes the dominant "Worst-Of" stock (92% probability weight)—suddenly 100% of the bank's long downside Vega and short-put Vanna concentrates onto TSLA alone, suppressing TSLA 6-to-12 month downside put IV relative to realized volatility!
Structured-Note Flow Impact Matrix Across Global Volatility Desks#
| Structured Product Type | Dominant Underlying Assets | Dealer Net Inventory Position | Resulting Market Surface Distortion | Institutional Hedge-Fund Trade |
|---|---|---|---|---|
| Worst-of Single-Stock Autocall | NVDA, TSLA, AAPL, AMD, META, AMZN | Long Stock Vega + Short Correlation (∂V/∂ρ < 0) | Cheapens 6M–18M single-stock OTM puts on "Autocall Darlings" + bids up custom ρ! | Long Custom Autocall-Basket Dispersion (Buy cheap bank stock vol / sell QQQ/NDX!) |
| Worst-of Index Trio (SPX/RUT/SX5E) | SPX + Russell 2000 (RUT) + EURO STOXX 50 | Long Worst-of Index Put (Heavy concentration in RUT laggard!) | Depresses 1Y–2Y RUT downside put vol whenever RUT underperforms SPX by >12%! | Buy cheap 1Y RUT vol vs SPX (Cross-Index Dispersion) |
| Single-Index Autocall (ELS) | EURO STOXX 50, Nikkei 225, SPX | Long 1Y–3Y Index Down-and-In Vega (Flips SHORT Vega near 60% KI!) | Crushes 1Y–2Y SX5E implied vol in calm bull markets; explodes if index drops −35%! | Buy cheap 1Y SX5E forward volatility / Reverse Dispersion |
| Outperformance / Cliquet Notes | Best-of Sector Pairs | Short Correlation (∂V/∂ρ < 0) | Bids inter-sector correlation | Sell Tier-1 Sector ETF Correlation |
1-Year 60% Knock-In Put Fair Value (% of Notional, σ_i = 35%) vs Correlation#
Tracking monthly SEC 424B2 structured-note filings on EDGAR reveals exactly which 10 US stocks carry peak Worst-of Autocallable vega supply—allowing dispersion pods to buy constituent volatility straight from axed exotic bank desks at 1.5 vol points below screen mid!
Frequently asked questions
Intuitively, why does a Worst-of Put option increase in value when correlation DROPS?
Compare ρ = 1.00 versus ρ = 0.00 on a 3-stock basket (each stock has a 10% standalone chance of dropping 40%). If ρ = 1.00, all 3 stocks are identical twins—the probability that the worst stock drops 40% is still just 10%! If ρ = 0.00 (independent), the probability that AT LEAST ONE of the 3 drops 40% jumps to 1 − 0.903 = 27.1%—nearly 3x higher! Thus Worst-of Puts are SHORT correlation!
When a retail investor buys a Worst-of Autocallable note, what is the issuing bank’s correlation exposure?
The retail yield-seeker implicitly sells a 60% Down-and-In Worst-of Put to fund their 15% coupon, leaving the issuing bank LONG the Worst-of Put! Because a Worst-of Put loses value when pairwise correlation rises toward 1.00 (∂V_WoP / ∂ρ < 0), the bank is structurally SHORT correlation and LONG single-stock downside vega!
Why does a bank that is Short Correlation from Worst-of notes offer cheap constituent volatility to dispersion hedge funds?
To neutralize ∂Book/∂ρ < 0 and shed Basel III FRTB Residual Risk Add-On (RRAO) charges, the bank must BUY correlation—which means selling single-stock variance/puts on the popular autocall underlyings (NVDA, TSLA, AAPL, AMD) while bidding index or custom-basket variance! Long-dispersion pods step in on the exact opposite side.
How do Index Autocallables versus Worst-of Single-Stock Autocallables push bank volatility books in opposite directions?
Single-Index Autocallables (SX5E, HSCEI, SPX) leave banks LONG 1Y–3Y index downside vega, so banks sell index volatility into the market. Worst-of Single-Stock Autocallables (NVDA/TSLA/AMD) leave banks LONG Worst-of Puts (short correlation, long constituent put vega), so banks sell constituent volatility and buy correlation via custom dispersion swaps!
Publication record
- Published
- November 12, 2026
- Updated
- November 14, 2026
- Author
- Dr. Alistair Finch, CQF, FRM
- Review
- Review not recorded
- Automated fact check
- Passed in the stored pipeline record
- Source URLs
- 3 recorded
AI assistance recorded: anthropic/claude-opus-4.6. This field does not establish human review or source verification.
Academic & Institutional Attribution
Cite This Research & Embed Live Data Card
Standard academic & institutional research paper citation format.
Dr. Alistair Finch, CQF, FRM. (2026, November 14). Worst-of Basket Autocallable Notes: Structured-Product Correlation Supply. VolSurface Desk. https://volsurfacedesk.com/desk-notes/worst-of-autocallable-structured-notes-correlation-supplyRelated Index Dispersion Correlation Desk & Institutional Briefings
Explore Index Dispersion Correlation Desk Hub (20) →Index Dispersion Correlation Desk
Implied Correlation, Index Dispersion Baskets & Earnings Vol Crush: Desk ManualIndex Dispersion Correlation Desk
Ex-Dividend American Call Early-Exercise Traps in Equity DispersionIndex Dispersion Correlation Desk
Cross-Index Dispersion Arbitrage: S&P 500 (SPX) vs Russell 2000 & EURO STOXX 50Index Dispersion Correlation Desk
Intraday 0DTE & Weekly Friday Dispersion: Mega-Cap Gamma vs SPXWIndex Dispersion Correlation Desk
FINRA Rule 4210 TIMS & Prime-Broker Margin Netting on Equity DispersionIndex Dispersion Correlation Desk
M&A Merger Arbitrage Options: Pricing Bimodal Deal-Break W-Shaped SmilesIndex Dispersion Correlation Desk
Cboe COR1M & COR3M Implied Correlation Indices: Top-50 SPX Math & SignalsIndex Dispersion Correlation Desk
Vega-Neutral vs Theta-Neutral vs Variance-Neutral Dispersion Leg SizingMarket Insights
US tech stock rout: is the AI bubble bursting?Regulatory Benchmarks
Listed Options, Futures & Volatility Derivatives Venues 2026 Licensing Benchmark: 6D Prudential Scorecard Across 72 Audited EntitiesCompliance Forensics
How to Verify Listed Options, Futures & Volatility Derivatives Venues Licences & Detect Clone Firms: 2026 Supervisory Lookup PlaybookSolvency and Protection
Investor Compensation Ceilings, Client-Money Segregation & Counterparty Risk Matrix in Listed Options, Futures & Volatility Derivatives Venues (2026)
VolSurface Desk Data, Benchmarks & Contributor Records
CC BY 4.0 Open Data
Open Institutional Datasets (CSV / JSON) →
Download desk-compiled quantitative series & schemas.
2026 Reference Matrix
2026 Institutional Benchmarks & Thresholds →
Statutory capital, clearing, margin & rate conventions.
Editorial Records
Authors & Review Records →
View named contributors where those records are available.
Complete Index
Master Research & Dossier Archive →
Browse all published briefings by topic pillar & date.