
Index Dispersion Correlation Desk
Equity Repo & Hard-to-Borrow Short-Fee Spikes in Single-Stock Dispersion
Plug standard SOFR risk-free rates into Black-Scholes on a heavily shorted constituent stock, and you will hallucinate massive "cheap calls and 90% put implied volatility"! In reality, a −18% hard-to-borrow stock loan fee shifted the synthetic forward.
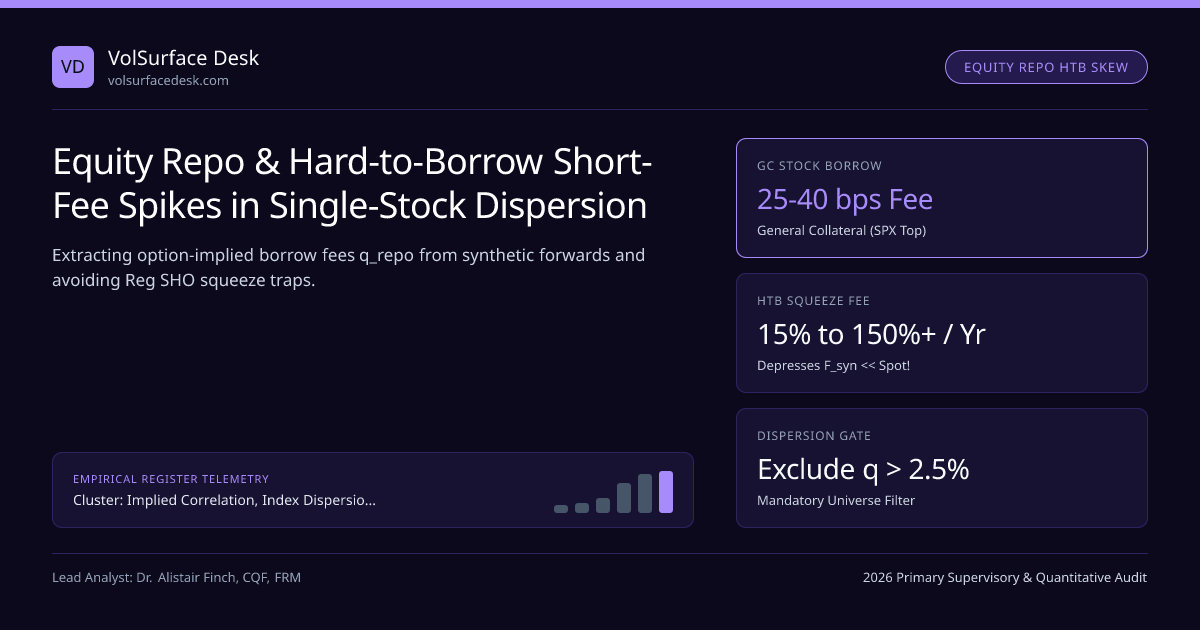
Open an amateur options analytics terminal on a heavily shorted mid-cap or turnaround stock trading at $100.00, and you will frequently witness a bizarre mirage on the 6-month chain: the $100 Call implies 41% volatility, while the $100 Put implies 63% volatility—an apparent 22-vol-point put-call parity violation! Attempt to "arbitrage" that gap by selling the $100 Put, buying the $100 Call, and shorting 100 shares of stock, and your prime broker's overnight stock-loan report delivers a rude awakening: short sellers are paying an annualized 24.0% Hard-to-Borrow (HTB) fee, pushing the true 6-month forward down to $90.48!
Within our Implied Correlation, Index Dispersion Baskets & Earnings Vol Crush silo and Dispersion Desk Manual, accounting for Equity Repo / Stock-Loan Borrow Rates (q_repo) alongside CME SOFR OIS discounting is essential whenever trading single-stock volatility or Russell 2000 / S&P 500 Dispersion.
Exact Synthetic Forward & Implied Borrow-Rate Extraction Equations#
Let r denote the CME SOFR risk-free OIS rate, PV(Div) denote the discounted cash dividend stream over [0, T], and qrepo ≥ 0 denote the annualized proportional stock-borrow fee (spread below the General Collateral short rebate). Under European Put-Call Parity (or Binomial/PDE-stripped American parity near ATM), Call and Put prices at strike K lock in the **Implied Synthetic Forward Fsyn(T)**:
- Inverting for the Option-Implied Annualized Stock Borrow Fee q_repo(T):
- qrepo(T) = r − (1 / T) · ln( Fsyn(T) / [ S0 − PV(Div) ] )
- Worked Numerical Proof (Spot S0 = $100.00, Zero Dividend, T = 0.50 yr, SOFR r = 4.50%, Observed 6M $100 Call = $11.85, Observed 6M $100 Put = $20.98):
- 1) True Implied Forward: F_syn(0.5) = $100 + e^(0.045×0.5) × ($11.85 − $20.98) = $100 − 1.02276 × $9.13 = $90.66 (Forward sits $9.34 BELOW Spot!!).
- 2) Implied Borrow Fee: q_repo = 0.045 − (1 / 0.50) · ln(90.66 / 100.00) = 0.045 − 2 × (−0.09805) = 0.045 + 0.1961 = 24.11% / year!
- 3) True Implied Volatility at F_syn = $90.66: BOTH the $100 Call and $100 Put price at the EXACT SAME arbitrage-free Black-76 implied volatility of 52.0%!
Verify how changing dividend/borrow carry shifts Call versus Put prices at fixed implied volatility directly inside our Black-Scholes Calculator, Implied Volatility Calculator, and Futures Fair Value Calculator.
Institutional Single-Stock Surface Pre-Processor: Borrow & Dividend Strip#
The Inverted Early-Exercise Trap When Borrow Fee Exceeds SOFR (q_repo > r)!#
Every options textbook teaches that "American calls on non-dividend-paying stocks are never exercised early." FALSE on Hard-to-Borrow stocks! Look at the net carry rate on the stock when SOFR r = 4.50% and borrow fee q_repo = 24.11%:
- Net Equity Carry (r − q_repo = −19.61% < 0!): A long physical shareholder who lends out their shares through an OCC Stock Loan or prime-broker fully-paid lending desk earns +24.11%/yr in lending fees, whereas an unlent call holder earns zero!
- Therefore, deep in-the-money American CALLS on zero-dividend HTB stocks MUST be exercised early so the holder can collect the 24.11% lending fee—and American PUTS are NEVER exercised early because short carry is deeply negative! Every textbook rule flips upside down when q_repo > r!
Stock-Loan Regimes & Dispersion Portfolio Rules#
| Stock-Loan Tier | Annualized Borrow Fee (q_repo) | Synthetic Forward vs Spot | Early-Exercise Regime | Dispersion Desk Mandate |
|---|---|---|---|---|
| General Collateral (GC) | 0.20% – 0.45% | Normal Contango (F > S ex-div) | Put early exercise (r > 0) + Ex-div Calls | Approved Core Dispersion Universe (Top-100 SPX) |
| Warm / Special | 1.50% – 5.00% | Flat Forward (q_repo ≈ r) | Near-European (Low call & put EE) | Cap weight ≤ 1.5%; monitor prime-broker locate daily |
| Hard-to-Borrow (HTB) | 10.0% – 50.0% | Steep Backwardation (F << S) | Inverted! Deep-ITM Calls Exercised Early! | STRICTLY EXCLUDE from long/short dispersion legs! |
| Squeeze / Recall (Reg SHO) | 50.0% – 300%+ | Extreme Backwardation + Wide Spreads | Immediate Call Exercise + Forced Buy-Ins | Never trade Reversals; trade pure defined-risk verticals only |
Optical IV Mirage When Ignoring a 24.1% Borrow Fee (6M ATM $100 Strike)#
Notice Metric #4 (28% of Russell 2000 small-caps trade Warm or Hard-to-Borrow): that single stock-loan fact explains why institutional desks overwhelmingly prefer S&P 500 and Nasdaq-100 constituents for cash-hedged dispersion! Portfolio risk engines connect this analysis to Nasdaq-100 (NDX / VXN) Tech & AI Semiconductor Dispersion alongside Worst-of Autocallable Notes & Bank Correlation Supply.
Frequently asked questions
How do options market makers observe a stock’s implied borrow fee directly on the OPRA option screen?
Via a Conversion / Reversal (Synthetic Forward) quote on European-equivalent or low-early-exercise near-ATM strikes! By Put-Call Parity, F_implied(T) = K + exp(r_SOFR · T) × (Call_Mid(K) − Put_Mid(K)). Solving F_implied(T) = S · exp((r_SOFR − d − q_repo)·T) reveals the exact market-implied annualized borrow fee q_repo in real time!
Why do American-style deep in-the-money puts complicate synthetic forward extraction on hard-to-borrow stocks?
Wait—think carefully about sign! When r − q_repo turns NEGATIVE (say SOFR = 4.5% minus 25% borrow fee = −20.5% net carry!), holding short stock is punitive while holding a deep-ITM American CALL becomes optimal to exercise early to capture the high lending fee! Conversely, when r > 0 and borrow is easy, deep-ITM American PUTS carry positive early-exercise premium. Always extract F_syn from near-ATM strikes paired with a binomial/PDE American solver!
What is a "Reversal Blowup" on an equity options market-making desk?
A Reversal consists of Long Call + Short Put (Synthetic Long Stock) hedged against Short 100 Physical Shares, locking in the stock-loan rebate spread. If a retail short squeeze hits (e.g., GME, AMC, CVNA) and the prime-broker stock-loan fee spikes from 3% to 120%/yr—or worse, a Reg SHO Rule 204 forced buy-in recalls your shares—the desk bleeds massive daily borrow fees!
Why must S&P 500 and Russell 2000 dispersion baskets screen out Hard-to-Borrow (HTB) stocks?
Delta-hedging a long straddle on a constituent stock requires shorting shares whenever the stock rallies above strike! If that stock becomes Hard-to-Borrow (q_repo > 3%), your prime broker bills you punitive daily borrow charges on your short equity delta hedge, AND early-exercise of short calls or wide option spreads destroys dispersion carry.
Publication record
- Published
- November 12, 2026
- Updated
- November 14, 2026
- Author
- Dr. Alistair Finch, CQF, FRM
- Review
- Review not recorded
- Automated fact check
- Passed in the stored pipeline record
- Source URLs
- 3 recorded
AI assistance recorded: anthropic/claude-opus-4.6. This field does not establish human review or source verification.
Academic & Institutional Attribution
Cite This Research & Embed Live Data Card
Standard academic & institutional research paper citation format.
Dr. Alistair Finch, CQF, FRM. (2026, November 14). Equity Repo & Hard-to-Borrow Short-Fee Spikes in Single-Stock Dispersion. VolSurface Desk. https://volsurfacedesk.com/desk-notes/hard-to-borrow-short-rebate-spikes-single-stock-skewRelated Index Dispersion Correlation Desk & Institutional Briefings
Explore Index Dispersion Correlation Desk Hub (20) →Index Dispersion Correlation Desk
Implied Correlation, Index Dispersion Baskets & Earnings Vol Crush: Desk ManualIndex Dispersion Correlation Desk
Nasdaq-100 (NDX / VXN) Tech & Semiconductor Dispersion vs S&P 500Index Dispersion Correlation Desk
Worst-of Basket Autocallable Notes: Structured-Product Correlation SupplyIndex Dispersion Correlation Desk
Ex-Dividend American Call Early-Exercise Traps in Equity DispersionIndex Dispersion Correlation Desk
Cross-Index Dispersion Arbitrage: S&P 500 (SPX) vs Russell 2000 & EURO STOXX 50Index Dispersion Correlation Desk
Intraday 0DTE & Weekly Friday Dispersion: Mega-Cap Gamma vs SPXWIndex Dispersion Correlation Desk
FINRA Rule 4210 TIMS & Prime-Broker Margin Netting on Equity DispersionIndex Dispersion Correlation Desk
M&A Merger Arbitrage Options: Pricing Bimodal Deal-Break W-Shaped SmilesMarket Insights
Crypto Liquidations Top $1 Billion as Bitcoin Tests 11-Week LowMarket Insights
Bitcoin holds $75K as AI regulation fears see KOSPI halted after 8% crashMarket Insights
US tech stock rout: is the AI bubble bursting?Regulatory Benchmarks
Listed Options, Futures & Volatility Derivatives Venues 2026 Licensing Benchmark: 6D Prudential Scorecard Across 72 Audited Entities
VolSurface Desk Data, Benchmarks & Contributor Records
CC BY 4.0 Open Data
Open Institutional Datasets (CSV / JSON) →
Download desk-compiled quantitative series & schemas.
2026 Reference Matrix
2026 Institutional Benchmarks & Thresholds →
Statutory capital, clearing, margin & rate conventions.
Editorial Records
Authors & Review Records →
View named contributors where those records are available.
Complete Index
Master Research & Dossier Archive →
Browse all published briefings by topic pillar & date.