
Index Dispersion Correlation Desk
Implied Correlation Skew: Why 90% Put Correlation Beats 110% Calls by 25+ Pts
Individual stocks like Apple and Microsoft have relatively modest downside put skew, yet the S&P 500 index exhibits one of the steepest 25-delta put skews in global finance. The mathematical bridge between the two is Implied Correlation Skew: ρ(K/F).
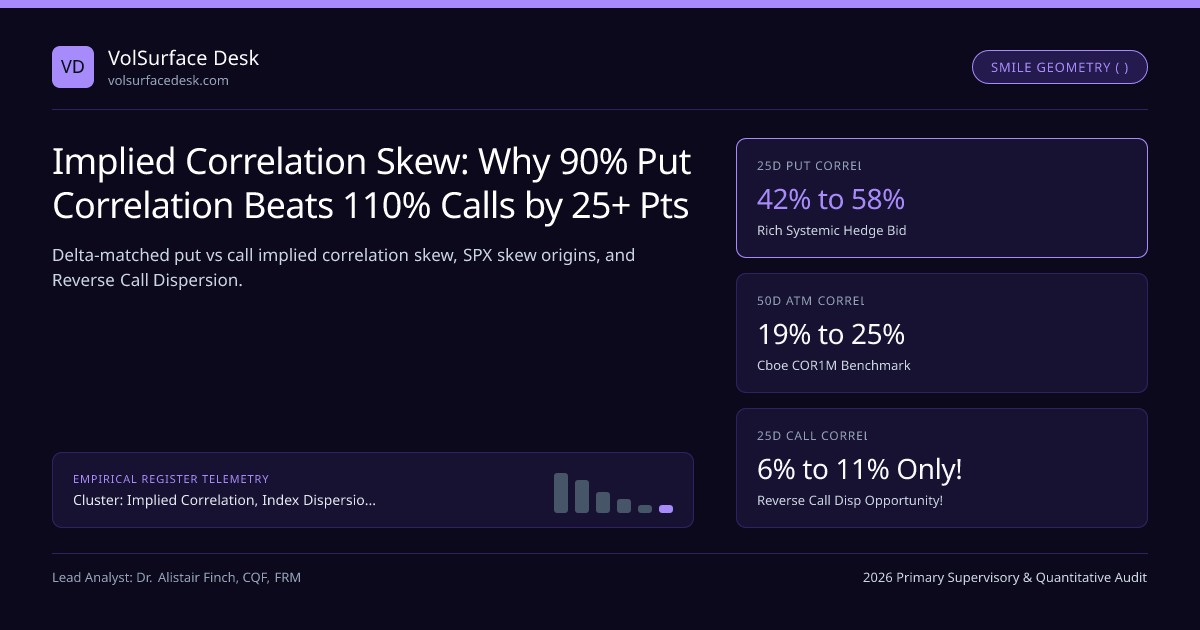
Here is one of the deepest structural puzzles in quantitative finance: measure the 3-month 25-Delta Put minus 25-Delta Call Risk Reversal on individual S&P 500 stocks like Microsoft, JPMorgan, or Eli Lilly, and you typically observe a modest +2.5 to +4.0 vol points of put skew (on a 26% ATM base—barely 12% of ATM vol). Measure the exact same 3-month 25-Delta Put minus Call skew on the S&P 500 Index (SPX 25d Skew), and you see +5.8 to +7.8 vol points on a 13.5% ATM base—over 50% of ATM volatility! Where does all that extra index skew come from? Implied Correlation Skew (∂ρ_imp / ∂Δ)!
Within our Implied Correlation, Index Dispersion Baskets & Earnings Vol Crush silo and Dispersion Desk Manual, mapping implied correlation across Delta space unlocks two distinct institutional strategies: Capped Downside Put Dispersion and Reverse Upside Call Dispersion.
Exact Delta-Matched Implied Correlation Curve Across the Smile#
As highlighted in our FAQ, comparing fixed 90% moneyness on SPX (−10% index crash) against 90% moneyness on Nvidia (−10% normal weekly wiggle!) compares apples to oranges. Institutional quants align quantiles via Black-Scholes Delta q ∈ {10d Put, 25d Put, 50d ATM, 25d Call, 10d Call} (corresponding to identical Gaussian copula marginal probabilities Φ−1(q)), defining the Delta-Matched Implied Correlation Smile ρ_imp(Δ):
- First-Order Index Skew Decomposition (differentiating σ_I ≈ √ρ · σ̄ with respect to log-strike k around ATM):
- ∂σSPX / ∂k ≈ √ρATM · ( ∑ wi · ∂σi/∂knorm ) + [ σ̄ / (2 · √ρATM) ] · ( ∂ρ / ∂k ) ← Correlation Skew generates >60% of SPX Put Skew!
- Worked 3-Month S&P 500 Empirical Smile Decomposition (Rescaled Top-50, H_σ ≈ 0.080):
- • 25-Delta Put Wing: σSPX(25P) = 18.40%, Avg Stock σ̄(25P) = 30.20% ⇒ ρimp(25d Put) = (0.371 − 0.080) / (1 − 0.080) = 31.6% (and 49.4% at 10d Put!).
- • 50-Delta ATM Center: σSPX(50d) = 13.50%, Avg Stock σ̄(50d) = 27.50% ⇒ ρimp(50d ATM) = (0.241 − 0.080) / 0.920 = 17.5%.
- • 25-Delta Call Wing: σSPX(25C) = 10.60%, Avg Stock σ̄(25C) = 27.10% (Retail AI Call Bid!) ⇒ ρimp(25d Call) = (0.153 − 0.080) / 0.920 = 7.93%!!
Price and verify 25-delta put and call strikes across SPX and constituent smiles using our Implied Volatility Calculator, Black-Scholes Calculator, and SABR/SVI Arbitrage-Free Surface Guide.
Supply-Demand Anatomy of the S&P 500 Implied Correlation Skew#
Reverse Upside Call Dispersion: Buying Correlation at 7.9% Where Realized Prints 30%!#
Look closely at that 7.93% 25-Delta Call Implied Correlation in our worked derivation above! What actually happens during a violent macro relief rally—such as November–December 2023 when the Federal Reserve pivoted dovish and Treasury yields dropped 90 bps?
- Broad equity indices rally +9% in six weeks with realized upside correlation of 32% to 44%!
- Meanwhile, because retail call buyers had already pumped 25d single-stock call IVs to 30%–50% while JPMorgan Collar & BuyWrite ETFs crushed 25d SPX call IV down to 10.6%, an institutional desk running Reverse Upside Call Dispersion (Long 25d SPX Calls at 10.6v / Short 25d Constituent Calls at 27.1v, delta-hedged daily) buys correlation at 7.9% and realizes 35%—earning +27 correlation points WITH POSITIVE MACRO RALLY CONVEXITY!
Wing-Specific Dispersion Strategy Matrix Across the Smile#
| Smile Segment | Delta / Moneyness Pillar | Typical Implied ρ | Long-Run Realized ρ | Optimal Institutional Strategy | Mandatory Risk Guardrail |
|---|---|---|---|---|---|
| Deep Crash Wing | 10-Delta Put (~86% SPX) | 48% – 62% | 65% – 88% (Conditional on Crash!) | DO NOT Sell Uncapped! Use as long tail cap | Buy 10d SPX put wing to cap 25d Put Dispersion! |
| Core Put Skew | 25-Delta Put (~94% SPX) | 30% – 38% | 19% – 24% (Moderate Selloffs) | Put-Spread Dispersion (Short SPX 95/87P vs Long Stock Puts) | Match strikes by Delta/σ, NEVER raw % moneyness! |
| ATM Straddle Core | 50-Delta ATM (100% Fwd) | 18% – 25% | 13% – 17% | Classic Index Dispersion (√ρ Sizing) | Monitor strike drift into OTM call/put wings |
| Upside Rally Wing | 25-Delta Call (~105% SPX) | 6% – 11% | 22% – 36% (Macro Rallies!) | Reverse Call Dispersion (Long SPX 25d Call / Short Stock 25d Calls!) | Cap single-stock short calls on M&A / short-squeeze names! |
Implied vs Conditional Realized Correlation Across SPX Moneyness Pillars#
One operational warning on Reverse Upside Call Dispersion: never sell uncapped upside calls on high-short-interest Biotech or M&A takeover candidates (see M&A Bimodal Deal-Break Smiles); restrict your short 25d call basket strictly to mega-cap and large-cap liquid constituents!
Frequently asked questions
How do you match strikes between SPX and single stocks when measuring Implied Correlation Skew—fixed % moneyness or normalized z-score (delta) moneyness?
CRITICAL distinction! A −10% move in SPX (m = 0.90, ~2.8 standard deviations at 14% 3M vol) corresponds to a −20% move in a 28%-vol single stock at the same 2.8σ probability (or 15-delta)! If you compare m = 0.90 SPX puts against m = 0.90 stock puts, you overstate put correlation; matching by Delta (25d Put vs 25d Put, 25d Call vs 25d Call) gives the true probability-matched Implied Correlation Skew—which STILL slopes downward by 22 to 32 correlation points!
Why is upside 25-delta Call Implied Correlation so extraordinarily low (often 5% to 11%)?
Two titanic institutional flows collide on the upside wing: first, systematic covered-call ETFs (JEPI, JEPQ, XYLD) and pension BuyWrite programs relentlessly sell index calls on SPX/NDX, depressing σ_SPX(25d Call) to 10%–11%; second, retail traders aggressively buy upside single-stock calls on AI and momentum stocks, bidding up σ_stock(25d Call)!
Can you actually buy cheap correlation on the upside wing—Long SPX Calls vs Short Single-Stock Calls?
Yes! "Reverse Upside Call Dispersion" (buying cheap 25d–30d SPX/NDX calls at 10.5% IV while selling frothy 25d calls on top-25 constituents at 32%–48% IV, delta-hedged or collar-paired) is one of the highest-Sharpe relative-value trades on equity exotic desks whenever upside call ρ_imp dips below 8%!
How do multi-asset surface quants prevent arbitrage between single-stock SVI surfaces and the SPX SVI surface?
By checking the Basket-Index Copula Bounds! At every expiry T and quantile q, SPX implied volatility cannot exceed the perfectly co-monotonic upper bound ∑ w_i σ_i(q) (ρ = 1.00) or breach the variance positivity lower bound!
Publication record
- Published
- November 13, 2026
- Updated
- November 14, 2026
- Author
- Dr. Alistair Finch, CQF, FRM
- Review
- Review not recorded
- Automated fact check
- Passed in the stored pipeline record
- Source URLs
- 3 recorded
AI assistance recorded: anthropic/claude-opus-4.6. This field does not establish human review or source verification.
Academic & Institutional Attribution
Cite This Research & Embed Live Data Card
Standard academic & institutional research paper citation format.
Dr. Alistair Finch, CQF, FRM. (2026, November 14). Implied Correlation Skew: Why 90% Put Correlation Beats 110% Calls by 25+ Pts. VolSurface Desk. https://volsurfacedesk.com/desk-notes/implied-correlation-skew-downside-put-vs-upside-callRelated Index Dispersion Correlation Desk & Institutional Briefings
Explore Index Dispersion Correlation Desk Hub (20) →Index Dispersion Correlation Desk
Implied Correlation, Index Dispersion Baskets & Earnings Vol Crush: Desk ManualIndex Dispersion Correlation Desk
OTC Clean Correlation Swaps vs Option-Strip "Dirty" Dispersion MechanicsIndex Dispersion Correlation Desk
Two-Tier Sector Dispersion: SPX vs Sector ETFs (XLK, XLF, XLE, XLV) vs StocksIndex Dispersion Correlation Desk
Post-Earnings Volatility Crush & PEAD Calendar / Diagonal Option SpreadsIndex Dispersion Correlation Desk
Equity Repo & Hard-to-Borrow Short-Fee Spikes in Single-Stock DispersionIndex Dispersion Correlation Desk
Nasdaq-100 (NDX / VXN) Tech & Semiconductor Dispersion vs S&P 500Index Dispersion Correlation Desk
Worst-of Basket Autocallable Notes: Structured-Product Correlation SupplyIndex Dispersion Correlation Desk
Ex-Dividend American Call Early-Exercise Traps in Equity DispersionMarket Insights
Equity Dispersion Trade Risks a Blowup, Hedge Fund CEO Warns - Bloomberg.comMarket Insights
Traders bet on a pop for Anthropic's historic IPOMarket Insights
A massive trade in Nvidia just went off – here are the detailsRegulatory Compliance
CFTC warns Kalshi of imminent charges over notification of contracts: Politico
VolSurface Desk Data, Benchmarks & Contributor Records
CC BY 4.0 Open Data
Open Institutional Datasets (CSV / JSON) →
Download desk-compiled quantitative series & schemas.
2026 Reference Matrix
2026 Institutional Benchmarks & Thresholds →
Statutory capital, clearing, margin & rate conventions.
Editorial Records
Authors & Review Records →
View named contributors where those records are available.
Complete Index
Master Research & Dossier Archive →
Browse all published briefings by topic pillar & date.