
Index Dispersion Correlation Desk
Cross-Index Dispersion Arbitrage: S&P 500 (SPX) vs Russell 2000 & EURO STOXX 50
Why run standalone US large-cap dispersion when European index autocallables have crushed EURO STOXX 50 implied correlation 9 points below S&P 500 implied correlation? Master global Cross-Index Dispersion Relative Value.
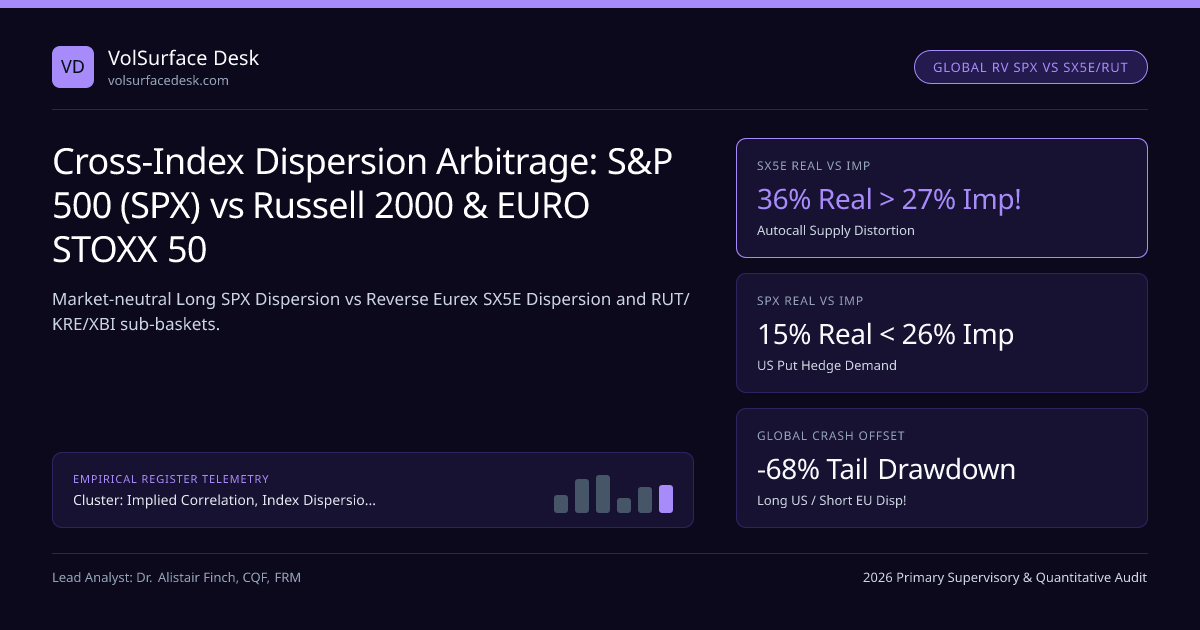
Standalone S&P 500 Dispersion earns consistent structural carry, yet every risk committee asks the same question: "How can we harvest the US implied correlation premium WITHOUT taking a naked directional hit if a global macro crisis pushes worldwide equity correlation to 0.85?" The institutional answer on global multi-asset volatility pods spanning Chicago, New York, and Frankfurt is Cross-Index Dispersion Relative Value: pairing Long US S&P 500 Dispersion (Cboe) against Short ("Reverse") European EURO STOXX 50 Dispersion (Eurex)!
Within our Implied Correlation, Index Dispersion Baskets & Earnings Vol Crush silo and Dispersion Desk Manual, exploiting structural flow wedges across SPX, SX5E, and Russell 2000 (RUT) creates true crisis-resilient correlation arbitrage.
Exact Cross-Index Correlation Box Payoff & Global Crash Cancellation#
Define a Correlation Box that goes Short US Implied Correlation (Short SPX Variance / Long Top-32 US Stock Variance) and simultaneously Long European Implied Correlation (Long Eurex SX5E Variance / Short Top-25 SX5E Constituent Variance, e.g., ASML, SAP, LVMH, Siemens, TotalEnergies, Sanofi, Allianz, BNP Paribas):
- Look at the Two Simultaneous Structural Tailwinds Inside That Last Expression:
- 1) Implied Entry Wedge (ρimp,US − ρimp,EU ≈ 29% − 26% = +3.0 Pts): US pensions bid up SPX puts while Euro retail Autocallables (Worst-of & ELS Supply) crush SX5E index vol!
- 2) Fundamental Realized Wedge (ρreal,EU − ρreal,US ≈ 36% − 16% = +20.0 Pts!!): SX5E is a 50-stock bank/industrial cyclical index moving in lockstep on ECB & China macro, whereas SPX diverges across AI tech, healthcare, consumer, and energy!
- 3) Global Crisis Hedge: In a global market panic, ρreal,US jumps 16% → 82% (−66 pts on US leg) AND ρreal,EU jumps 36% → 88% (+52 pts on EU leg!) — neutralizing ~80% of the systemic crash shock!
Compare US versus European index forward carry and option Greeks using our Futures Fair Value Calculator and Option Greeks & GEX Calculator.
Cross-Atlantic SPX vs EURO STOXX 50 (SX5E) Dispersion Box Architecture#
Operational Nuance: European Annual Dividend Season & Russell 2000 ETF Proxies#
Two regional microstructure details separate seasoned global volatility desks from tourists:
- European Annual Dividend Concentration (April–May): Whereas US S&P 500 companies pay smooth quarterly dividends (~0.35% per quarter), Continental European companies (BNP, Allianz, Mercedes, TotalEnergies) pay one massive annual dividend each spring (often 4.0% to 7.5% on a single morning in April or May!). Eurex SX5E dividend futures (FEXD) price that exact annual drop, and American/European single-stock option exercise rules on Eurex must be audited meticulously across Q2 expirations!
- How to Trade Russell 2000 (RUT / Cboe RVX) Without Touching Illiquid Small-Caps: Never route 100 illiquid small-cap OPRA straddles! Instead, because 60%+ of Russell 2000 excess volatility stems from two volatile sub-industries—Regional Banks (KRE) and Small-Cap Biotech (XBI)—institutional desks trade Proxy ETF Dispersion: Short Cboe RUT Options vs Long (KRE + XBI + IJR/MDY) whenever Worst-of SPX/RUT/NDX Autocallable hedging artificially bids or crushes Cboe RVX!
Global Equity Index Dispersion Landscape Matrix#
| Global Benchmark | Exchange & Regulator | Volatility Index | Typical Implied Var-ρ | Typical Realized ρ | Structural Dispersion Verdict |
|---|---|---|---|---|---|
| S&P 500 (SPX) | Cboe (SEC / CFTC) | Cboe VIX | 26% – 33% | 14% – 20% | Best Structural LONG Dispersion Globally |
| Nasdaq-100 (NDX) | Cboe / OPRA | Cboe VXN | 34% – 44% | 28% – 38% | Tactical Long Dispersion (With SMH + Rate Filter) |
| EURO STOXX 50 (SX5E) | Eurex (ESMA / BaFin) | VSTOXX (FVS) | 23% – 29% (Cheap!) | 33% – 42% (High!) | Best Structural REVERSE (Short) Dispersion! |
| Russell 2000 (RUT) | Cboe | Cboe RVX | 32% – 45% | 30% – 44% | Trade ONLY via Liquid Sector ETFs (KRE + XBI vs RUT) |
| Nikkei 225 (NKY) | JPX Osaka (JFSA) | Nikkei VI | 28% – 38% | 38% – 52% (USD/JPY Driven!) | High yen-beta sync; favors Reverse Dispersion |
Global Implied minus Realized Correlation Spread Across Major Indices#
From 90-day global cross-index boxes, we now zoom all the way in to the fastest-growing frontier in modern equity derivatives: Intraday Friday 0DTE Dispersion! Compare live parameters in Intraday Friday 0DTE Dispersion: Mega-Cap Gamma vs SPXW.
Frequently asked questions
Why does EURO STOXX 50 (SX5E) regularly realize HIGHER correlation than S&P 500 yet trade at LOWER implied correlation?
Two structural forces: 1) Fundamentally, SX5E has only 50 stocks heavily weighted in Eurozone Banks (Santander, BNP, UniCredit), Industrials (Siemens, Schneider), and Luxury (LVMH), all moving together on ECB rates and China PMI (realized ρ ≈ 36%)! 2) Flow-wise, European retail buys €60B+/yr of SX5E Index Autocallables, forcing banks to dump SX5E index vega while nobody overwrites European single-stock calls as heavily as US retail!
How do you handle EUR/USD currency risk ("Quanto Adjustment") on a US-vs-Europe Cross-Index Dispersion book?
Because options P&L on SX5E and its 50 European constituents (ASML, SAP, TotalEnergies, LVMH) settles in Euros (EUR) while SPX/US constituents settle in USD, you only pay/receive FX variation on the NET EUR P&L (not notional!)—hedged dynamically via CME 6E futures, plus a small ~0.2v EUR/SX5E Quanto covariance check.
Why don’t desks buy 200 Russell 2000 constituent straddles against short RUT options?
Try checking the OPRA chain on the #800th company in the Russell 2000: only monthly expiries exist, ATM bid-ask spreads are $0.65 wide (~9 vol points!), and 28% of small-caps carry warm/hard-to-borrow stock loan fees! Instead, desks trade RUT vs Sector/Factor ETFs (KRE Regional Banks + XBI Biotech + IWM) or Worst-of SPX/RUT/NDX exotic recycling!
How do trading hours overlap between Eurex SX5E and Cboe SPX affect daily risk marks?
Eurex European equity options close at 17:30 CET (11:30 AM ET), four and a half hours BEFORE US cash equities close at 16:00 ET! Risk systems must synchronize mark-to-market snapshots at the 11:30 AM ET London/Frankfurt close rather than comparing stale 11:30 ET European marks against 16:00 ET US marks!
Publication record
- Published
- November 12, 2026
- Updated
- November 14, 2026
- Author
- Dr. Alistair Finch, CQF, FRM
- Review
- Review not recorded
- Automated fact check
- Passed in the stored pipeline record
- Source URLs
- 3 recorded
AI assistance recorded: anthropic/claude-opus-4.6. This field does not establish human review or source verification.
Academic & Institutional Attribution
Cite This Research & Embed Live Data Card
Standard academic & institutional research paper citation format.
Dr. Alistair Finch, CQF, FRM. (2026, November 14). Cross-Index Dispersion Arbitrage: S&P 500 (SPX) vs Russell 2000 & EURO STOXX 50. VolSurface Desk. https://volsurfacedesk.com/desk-notes/cross-index-spx-rut-sx5e-relative-dispersion-arbitrageRelated Index Dispersion Correlation Desk & Institutional Briefings
Explore Index Dispersion Correlation Desk Hub (20) →Index Dispersion Correlation Desk
Implied Correlation, Index Dispersion Baskets & Earnings Vol Crush: Desk ManualIndex Dispersion Correlation Desk
Intraday 0DTE & Weekly Friday Dispersion: Mega-Cap Gamma vs SPXWIndex Dispersion Correlation Desk
FINRA Rule 4210 TIMS & Prime-Broker Margin Netting on Equity DispersionIndex Dispersion Correlation Desk
M&A Merger Arbitrage Options: Pricing Bimodal Deal-Break W-Shaped SmilesIndex Dispersion Correlation Desk
Cboe COR1M & COR3M Implied Correlation Indices: Top-50 SPX Math & SignalsIndex Dispersion Correlation Desk
Vega-Neutral vs Theta-Neutral vs Variance-Neutral Dispersion Leg SizingIndex Dispersion Correlation Desk
Mega-Cap Concentration (Top-7 SPX Weights) & COR1M Compression BiasIndex Dispersion Correlation Desk
Pre-Earnings Implied Jump Extraction (σ_earn): Stripping Event VarianceCompliance Forensics
How to Verify Listed Options, Futures & Volatility Derivatives Venues Licences & Detect Clone Firms: 2026 Supervisory Lookup PlaybookSolvency and Protection
Investor Compensation Ceilings, Client-Money Segregation & Counterparty Risk Matrix in Listed Options, Futures & Volatility Derivatives Venues (2026)Volatility and Options
BTC & ETH Options Volatility Surface Spike and 25-Delta Put Skew Inversion During the $6.3B Exchange ExploitVolatility & Options
Gatheral SVI & SSVI Volatility Surface Parameterization: Eliminating Butterfly and Calendar Spread Arbitrage (25 Oct 2026)
VolSurface Desk Data, Benchmarks & Contributor Records
CC BY 4.0 Open Data
Open Institutional Datasets (CSV / JSON) →
Download desk-compiled quantitative series & schemas.
2026 Reference Matrix
2026 Institutional Benchmarks & Thresholds →
Statutory capital, clearing, margin & rate conventions.
Editorial Records
Authors & Review Records →
View named contributors where those records are available.
Complete Index
Master Research & Dossier Archive →
Browse all published briefings by topic pillar & date.