
Index Dispersion Correlation Desk
Cboe COR1M & COR3M Implied Correlation Indices: Top-50 SPX Math & Signals
Unpack the official Cboe Implied Correlation Index (COR1M, COR3M, COR1Y) calculation: top-50 S&P 500 constituent selection, 50-delta ATM implied volatility interpolation, term-structure slope signals, and timing dispersion entries.
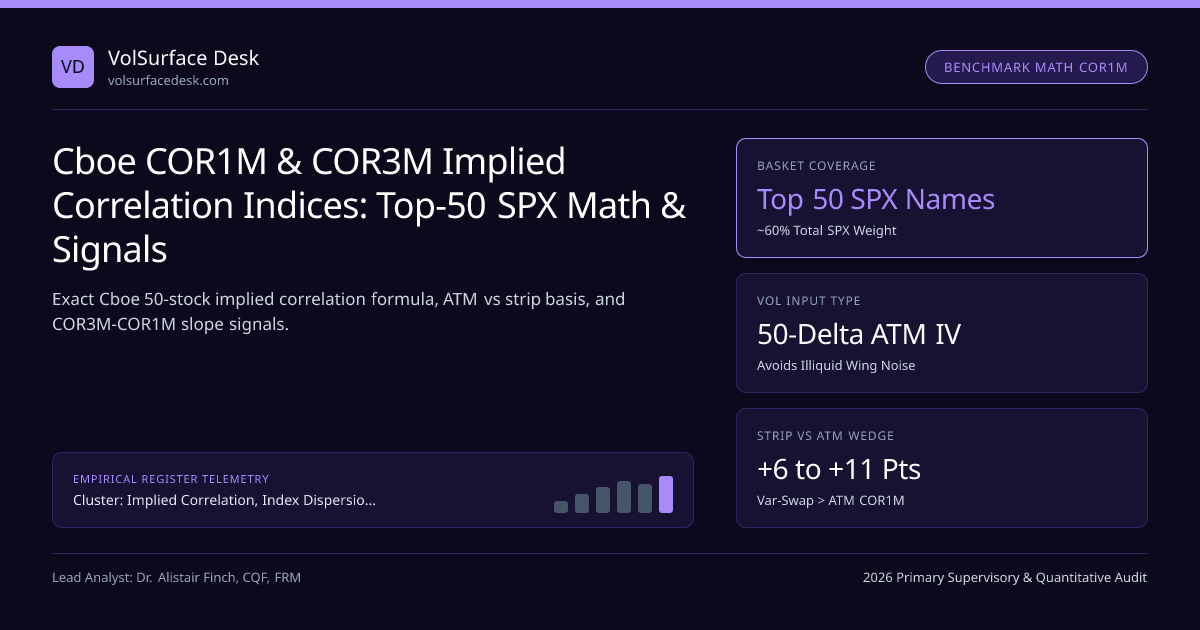
Before committing a single dollar of vega to an S&P 500 dispersion book, institutional volatility traders pull up two tickers on their Cboe analytics blotter: COR1M (30-day implied correlation) and COR3M (90-day implied correlation). Yet remarkably few market participants realize a critical methodological distinction: whereas the Cboe Volatility Index (VIX) integrates an entire strip of out-of-the-money puts and calls, Cboe COR1M and COR3M are computed strictly from 50-Delta At-the-Money implied volatilities across the 50 largest S&P 500 companies!
Within our Implied Correlation, Index Dispersion Baskets & Earnings Vol Crush silo and the Dispersion Desk Manual, understanding the exact algebraic mechanics—and structural blind spots—of Cboe's benchmark prevents costly mispricing between ATM straddle baskets and OTC variance dispersion.
Exact Cboe Constant-Maturity Top-50 Equicorrelation Formula#
Let S1, ..., S50 denote the 50 largest constituents of the S&P 500 ranked by float-adjusted market capitalization Mi, rescaled so normalized weights wi = Mi / ∑{k=1}^{50} Mk sum exactly to 1.00. For each bracketing expiration T1 (near-term) and T_2 (next-term), Cboe extracts the strike closest to 50-delta for SPX and each constituent i, computes constant-maturity total variance via time-weighted interpolation, and solves the equicorrelation equation:
- Denominator Algebraic Shortcut (O(N) Linear Time instead of O(N2) Double Loop!): ∑{i ≠ j} wi wj σi σj = ( ∑{i=1}^{50} wi · σi )2 − ∑{i=1}^{50} wi2 · σ_i2.
- Constant-Maturity Variance Interpolation (for target M = 30 days on COR1M): σ2(30d) = [ T1·σ2(T1)·(N2−30)/(N2−N1) + T2·σ2(T2)·(30−N1)/(N2−N1) ] × (365 / 30).
- Worked Numerical Verification (SPX 30d ATM IV = 13.80%, Rescaled Top-50 Weighted Avg Stock ATM IV ∑ wi σi = 27.60%, Diagonal Term ∑ wi2 σi2 = 0.00315):
- Numerator = 0.13802 − 0.00315 = 0.019044 − 0.00315 = 0.015894; Denominator = 0.27602 − 0.00315 = 0.076176 − 0.00315 = 0.073026 ⇒ COR1M = 100 × (0.015894 / 0.073026) = 21.76!
Traders invert constituent ATM option prices into implied volatilities using our Implied Volatility Calculator and cross-check forward-adjusted 50-delta strike interpolation in the Black-Scholes Calculator.
Cboe COR1M / COR3M Real-Time Index Computation Pipeline#

Two Critical Structural Wedges: Top-50 Weight Rescaling vs Skew Strip Basis#
Why does an institutional desk pricing an OTC SPX Variance Swap dispersion package see an implied correlation of 31.5% on the exact same afternoon that Cboe's COR3M screen flashes 22.4%? Two mathematical wedges account for the entire 9.1-point gap:
- The Skew-Convexity Wedge (+6.5 to +9.5 Points): SPX index options carry a dramatically steeper downside put skew (see SPX 25-Delta Skew & Cboe SKEW) than individual equities! When you integrate 1/K2 across all strikes to price a variance swap, SPX variance jumps by +25% to +38% over its 50-delta ATM variance (e.g., 13.8% ATM IV → 16.4% Var-Swap Vol), whereas single-stock variance swaps only sit +8% to +14% above ATM IV! That extra index wing convexity inflates Variance-Implied Correlation far above ATM-Implied COR1M. We dissect this moneyness gradient in Implied Correlation Skew: Put Wings vs Call Wings.
- The Top-50 Rescaling Bias (−1.5 to −3.0 Points): Rescaling the top 50 weights from ~0.60 up to 1.00 multiplies every wi by ~1.67, which multiplies ∑ wi2 σi2 by 1.672 ≈ 2.78×! Subtracting a 2.78× larger idiosyncratic diagonal term from actual 500-stock σSPX2 slightly depresses COR1M—an effect magnified during AI mega-cap rallies, as proven in Mega-Cap Concentration & COR1M Compression.
Reading the COR Term Structure: COR1M vs COR3M vs COR1Y#
| Term-Structure Regime | Typical Spread (COR3M − COR1M) | Underlying Market Microstructure Driver | Institutional Dispersion Desk Action |
|---|---|---|---|
| Pre-Earnings Steep Contango | +7.0 to +14.5 Pts (e.g., COR1M = 14, COR3M = 26) | Upcoming 30d window packed with AAPL/NVDA/MSFT earnings jumps lifting σ_i(1M) | Avoid chasing cheap 1M short-index dispersion; harvest 1M/3M single-stock calendars |
| Normal Secular Carry | +2.5 to +5.5 Pts (e.g., COR1M = 21, COR3M = 25) | Balanced macro flow + structural SPX put-hedging demand across quarterly horizons | Core Theta/Variance-neutral S&P 500 Dispersion entry window |
| FOMC / CPI Macro Compression | −3.0 to +1.0 Pts (e.g., COR1M = 31, COR3M = 30) | Near-term SPX index straddles bid up ahead of Federal Reserve / CPI macro catalyst | Wait until post-announcement Vanna vol crush before scaling into short correlation |
| Panic Backwardation Spike | −10.0 to −22.0 Pts (e.g., COR1M = 68, COR3M = 49) | Acute liquidation shock driving realized ρ above 0.75 and VIX into backwardation | Monetize VIX tail hedges; leg into 3M–6M short correlation once VVIX peaks! |
Benchmark Wedge: Cboe ATM COR1M vs True 500-Stock Variance Correlation#
Always normalize Cboe COR1M against its 2-year rolling Herfindahl-adjusted z-score and pair it with the exact leg-sizing rules in Vega-Neutral vs Theta-Neutral Dispersion Sizing before routing baskets to Cboe and OPRA market makers.
Frequently asked questions
Why does Cboe calculate COR1M using only the top 50 S&P 500 stocks instead of all 500 constituents?
The bottom 350 S&P 500 companies frequently exhibit wide OPRA option bid-ask spreads, missing weekly expiries, and stale mid-quotes. The top 50 stocks represent roughly 58%–64% of total S&P 500 market capitalization while maintaining penny-to-nickel tight continuous option markets.
Does Cboe COR1M use model-free variance-swap volatilities like VIX or 50-delta ATM volatilities?
Official Cboe Implied Correlation methodology interpolates Black-Scholes 50-delta ATM call/put implied volatilities across two bracketing maturities! Because SPX has a much steeper downside put skew than individual stocks, variance-swap implied correlation typically prints 6 to 11 points higher than ATM COR1M.
How does Cboe maintain a constant 30-day or 90-day horizon as options decay toward expiration?
Prior to 2020 Cboe published fixed-maturity tickers (like KCJ or ICJ expiring in November). Modern COR1M and COR3M indices apply linear total-variance interpolation across two adjacent monthly expiries—identical to VIX constant-maturity weighting—eliminating calendar roll discontinuities.
When is a high COR1M print a genuine entry signal for selling index correlation?
Historically, when COR3M spikes above 42–48 points AFTER an initial VIX shock begins stabilizing (VVIX rolling over and VX1–VX2 backwardation narrowing), selling SPX volatility against top-35 single-stock volatility captures peak correlation mean reversion.
Publication record
- Published
- November 13, 2026
- Updated
- November 14, 2026
- Author
- Dr. Alistair Finch, CQF, FRM
- Review
- Review not recorded
- Automated fact check
- Passed in the stored pipeline record
- Source URLs
- 3 recorded
AI assistance recorded: anthropic/claude-opus-4.6. This field does not establish human review or source verification.
Academic & Institutional Attribution
Cite This Research & Embed Live Data Card
Standard academic & institutional research paper citation format.
Dr. Alistair Finch, CQF, FRM. (2026, November 14). Cboe COR1M & COR3M Implied Correlation Indices: Top-50 SPX Math & Signals. VolSurface Desk. https://volsurfacedesk.com/desk-notes/cboe-cor1m-cor3m-implied-correlation-triangle-mathRelated Index Dispersion Correlation Desk & Institutional Briefings
Explore Index Dispersion Correlation Desk Hub (20) →Index Dispersion Correlation Desk
Implied Correlation, Index Dispersion Baskets & Earnings Vol Crush: Desk ManualIndex Dispersion Correlation Desk
Vega-Neutral vs Theta-Neutral vs Variance-Neutral Dispersion Leg SizingIndex Dispersion Correlation Desk
Mega-Cap Concentration (Top-7 SPX Weights) & COR1M Compression BiasIndex Dispersion Correlation Desk
Pre-Earnings Implied Jump Extraction (σ_earn): Stripping Event VarianceIndex Dispersion Correlation Desk
Correlation-Spike Tail Risk: Why Dispersion Books Bleed in Macro PanicsIndex Dispersion Correlation Desk
Optimal 25-Stock Proxy Baskets vs Full 500-Stock S&P 500 DispersionIndex Dispersion Correlation Desk
Execution Microstructure Drag: OPRA Bid-Ask Spreads & Delta-Hedging SlippageIndex Dispersion Correlation Desk
Implied Correlation Skew: Why 90% Put Correlation Beats 110% Calls by 25+ PtsMarket Insights
Fuel prices drive Japan, Europe electricity futures to 4-year high - Nikkei AsiaMarket Insights
Nikkei 225 (Derivatives) Price (NI225/USD) Today | Live Price, Market Cap & Chart - BinanceMarket Insights
BC-Nikkei 225 Futures - Yahoo FinanceMarket Insights
Market positioning risks mount as macro hedge funds face worst stretch in years
VolSurface Desk Data, Benchmarks & Contributor Records
CC BY 4.0 Open Data
Open Institutional Datasets (CSV / JSON) →
Download desk-compiled quantitative series & schemas.
2026 Reference Matrix
2026 Institutional Benchmarks & Thresholds →
Statutory capital, clearing, margin & rate conventions.
Editorial Records
Authors & Review Records →
View named contributors where those records are available.
Complete Index
Master Research & Dossier Archive →
Browse all published briefings by topic pillar & date.