
Index Dispersion Correlation Desk
Optimal 25-Stock Proxy Baskets vs Full 500-Stock S&P 500 Dispersion
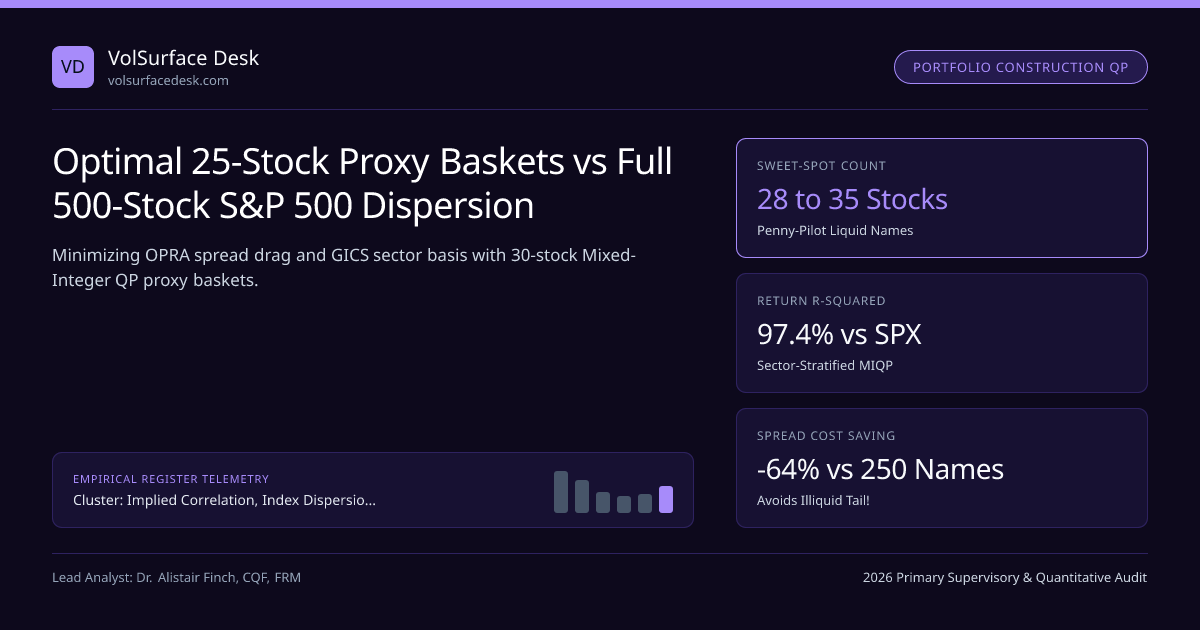
Trading options across all 500 S&P 500 constituents is operationally ruinous—bottom-300 OPRA bid-ask spreads devour your entire correlation edge. Learn how quantitative desks build 25-to-35 stock proxy baskets with 97.4% variance tracking.
In academic papers, S&P 500 Index Dispersion buys options on all 500 constituents in exact market-cap proportion w1, ..., w500. Try routing 500 simultaneous option straddles across OPRA at 10:15 AM ET in production, and you will discover an unforgiving microstructure wall: the smallest 300 S&P 500 companies contribute less than 13% of index capitalization yet quote 20-to-50 cent option bid-ask spreads with sparse open interest! Crossing those illiquid spreads destroys more P&L on Day 1 than six months of correlation carry can earn.
Within our Implied Correlation, Index Dispersion Baskets & Earnings Vol Crush silo and Dispersion Desk Manual, institutional desks solve this trade-off between Subset Tracking Error and OPRA Execution Friction via Stratified Mixed-Integer Quadratic Programming (MIQP) Proxy Baskets.
Exact Tracking-Error Variance vs Execution Cost Objective Function#
Let RI denote daily S&P 500 index return and RB(w̃) = ∑{i ∈ S} w̃i Ri denote the return of an M-stock subset S ⊂ {1..500} with normalized weights ∑ w̃i = 1. If a delta-hedged dispersion trade is Gamma-neutral, residual basis noise comes from Subset Tracking Variance τ2(w̃) = Var(RB(w̃) − RI)—which trades off directly against round-trip OPRA Bid-Ask + Hedging Cost C_exec(w̃):
- Subject to Linear Factor & Sector Constraints: ∑{i ∈ S} w̃i = 1, | ∑{i ∈ Sectorg} w̃i − W{SPX,g} | ≤ 0.015 (for all 11 GICS sectors g), and β_Basket = 1.00!
- Why Naive Top-25 Cap Rescaling Fails: Top-25 SPX names carry 48% Info Tech + Comm Services weight vs 41% in SPX, and 0.0% Utilities / Materials / Real Estate!
- Worked Comparison (90-Day Horizon, $100k Basket Vega):
- • Full 500 Stocks: Tracking Error τ = 0.00%/yr, Round-Trip OPRA Option + Hedge Slippage = $31,400 (3.14 vol pts!).
- • Naive Top-25 Cap-Weighted: Slippage drops to $8,900 (0.89v), BUT Tracking Error τ = 3.85%/yr (massive sector rotation noise!).
- • Stratified 32-Stock MIQP Proxy Basket: Slippage = $9,800 (0.98v) AND Tracking Error plunges to τ = 1.42%/yr (R2 = 98.9% against SPX daily variance!).
Desks evaluate constituent option spread widths in volatility terms using our Implied Volatility Calculator and compute portfolio Greeks across proxy weights in the Option Greeks & GEX Calculator.
Institutional 32-Stock MIQP Dispersion Proxy Basket Engine#
Regulatory Bonus: Why Proxy Basket Size Directly Governs FINRA 4210 Margin!#
Look closely at Step 4 in the flow diagram above—this is an operational rule every portfolio manager must memorize! Under OCC TIMS and FINRA Rule 4210 Portfolio Margin, prime brokers grant cross-product broad-based index correlation offsets (often 75%–85% haircut relief between short SPX and long single stocks) only when the single-stock basket meets minimum diversification cardinality and concentration thresholds (typically ≥ 20–25 constituents representing ≥ 50% covariance coverage without a single stock exceeding 15%–20% of the basket!). Drop from 28 stocks down to an concentrated 8-stock "Magnificent Eight vs SPX" trade, and your prime broker reclassifies the book from Index Dispersion to Uncorrelated Single-Stock Concentration—tripling your margin requirement overnight!
Proxy Basket Cardinality Trade-Off Table (S&P 500 Dispersion)#
| Basket Architecture | Constituent Count (M) | Raw SPX Cap Share | Annualized Return Tracking Error (τ) | Round-Trip OPRA Execution Drag | Prime-Broker TIMS Basket Offset |
|---|---|---|---|---|---|
| Concentrated Mega-Cap | 10 Stocks | ~38% | 5.60% / yr (Severe Sector Drift) | 0.65 Vol Pts | Penalized (Fails Broad-Basket Test!) |
| Naive Top-25 Cap | 25 Stocks | ~52% | 3.85% / yr (Missing Financials/Energy) | 0.89 Vol Pts | Partial (70%–75% Haircut Relief) |
| Stratified MIQP Proxy | 32 Stocks | ~56% (11 Sectors) | 1.42% / yr (Institutional Sweet Spot) | 0.98 Vol Pts | Full Broad-Basket Offset (80%–85%!) |
| Cboe Benchmark Top-50 | 50 Stocks | ~62% | 1.05% / yr | 1.38 Vol Pts | Full Offset (Higher Operational Load) |
| Full Replication | 500 Stocks | 100% | 0.00% / yr | 3.14+ Vol Pts (Unviable!) | Full Offset (Destroyed by OPRA Spreads) |
Net Retained Dispersion Alpha vs Constituent Count (M = 10 to 500)#
Once your 32-stock MIQP basket is selected, capturing that 2.14 Sharpe ratio requires disciplined execution across OPRA complex books and optimal delta-rehedging bands—the exact focus of our next note on Single-Stock Bid-Ask Spread & Delta-Hedging Drag.
Frequently asked questions
How many single stocks do real institutional dispersion desks actually trade against SPX?
Almost never 500! Depending on mandate and execution automation, multi-strategy pods trade 25 to 40 names for tactical 30-to-60 day option-strip dispersion, while dealer exotic desks hedging OTC Bespoke Dispersion Swaps run 35 to 60 highly liquid OPRA Penny Pilot names.
What went wrong with naive Top-25 Market-Cap proxy baskets during the March 2023 Silicon Valley Bank crisis?
In March 2023, regional banks (SIVB, FRC, ZION, CMA—all outside the Top 25!) crashed 40%–100% while Apple and Microsoft rallied as flight-to-safety havens! Desks running an unstratified Top-25 basket missed the regional-bank volatility explosion while paying SPX macro vol!
How do you mathematically formulate the Optimal Proxy Basket quadratic program (QP)?
Given candidate universe K (say the 80 most liquid OPRA option chains ranked by dollar vega volume / spread width), minimize basket-to-index return tracking variance w̃T Σ_KK w̃ − 2 w̃T Σ_KI + σ_I2 subject to ∑ w̃_i = 1, w̃_i ≥ 0, cardinality ||w̃||0 = M (e.g., M = 30 via Mixed-Integer QP or LASSO warm-start), and GICS sector neutrality!
Should proxy basket weights sum to 1.00 or to their raw SPX share (~0.55)?
Always rescale proxy weights so ∑_{i=1}^M w̃_i = 1.00 BEFORE applying your chosen Vega/Theta/Gamma leg-sizing ratio against SPX! Leaving ∑ w_i = 0.55 silently cuts your long constituent volatility leg in half!
Publication record
- Published
- November 13, 2026
- Updated
- November 14, 2026
- Author
- Dr. Alistair Finch, CQF, FRM
- Review
- Review not recorded
- Automated fact check
- Passed in the stored pipeline record
- Source URLs
- 3 recorded
AI assistance recorded: anthropic/claude-opus-4.6. This field does not establish human review or source verification.
Academic & Institutional Attribution
Cite This Research & Embed Live Data Card
Standard academic & institutional research paper citation format.
Dr. Alistair Finch, CQF, FRM. (2026, November 14). Optimal 25-Stock Proxy Baskets vs Full 500-Stock S&P 500 Dispersion. VolSurface Desk. https://volsurfacedesk.com/desk-notes/proxy-25-stock-basket-tracking-error-spx-dispersionRelated Index Dispersion Correlation Desk & Institutional Briefings
Explore Index Dispersion Correlation Desk Hub (20) →Index Dispersion Correlation Desk
Implied Correlation, Index Dispersion Baskets & Earnings Vol Crush: Desk ManualIndex Dispersion Correlation Desk
Execution Microstructure Drag: OPRA Bid-Ask Spreads & Delta-Hedging SlippageIndex Dispersion Correlation Desk
Implied Correlation Skew: Why 90% Put Correlation Beats 110% Calls by 25+ PtsIndex Dispersion Correlation Desk
OTC Clean Correlation Swaps vs Option-Strip "Dirty" Dispersion MechanicsIndex Dispersion Correlation Desk
Two-Tier Sector Dispersion: SPX vs Sector ETFs (XLK, XLF, XLE, XLV) vs StocksIndex Dispersion Correlation Desk
Post-Earnings Volatility Crush & PEAD Calendar / Diagonal Option SpreadsIndex Dispersion Correlation Desk
Equity Repo & Hard-to-Borrow Short-Fee Spikes in Single-Stock DispersionIndex Dispersion Correlation Desk
Nasdaq-100 (NDX / VXN) Tech & Semiconductor Dispersion vs S&P 500Market Insights
Top Wall Street analysts are confident about these 3 stocks for the long haulMarket Insights
Top Wall Street analysts are bullish on the growth potential of these 3 stocksMarket Insights
Equity Dispersion Trade Risks a Blowup, Hedge Fund CEO Warns - Bloomberg.comMarket Insights
Traders bet on a pop for Anthropic's historic IPO
VolSurface Desk Data, Benchmarks & Contributor Records
CC BY 4.0 Open Data
Open Institutional Datasets (CSV / JSON) →
Download desk-compiled quantitative series & schemas.
2026 Reference Matrix
2026 Institutional Benchmarks & Thresholds →
Statutory capital, clearing, margin & rate conventions.
Editorial Records
Authors & Review Records →
View named contributors where those records are available.
Complete Index
Master Research & Dossier Archive →
Browse all published briefings by topic pillar & date.