
Index Dispersion Correlation Desk
Mega-Cap Concentration (Top-7 SPX Weights) & COR1M Compression Bias
When COR1M plunged below 9.0 in 2024–2026, macro commentators screamed "historic bubble complacency!" Quantitative dispersion desks knew better: top-7 AI mega-cap concentration mathematically forces equicorrelation downward.
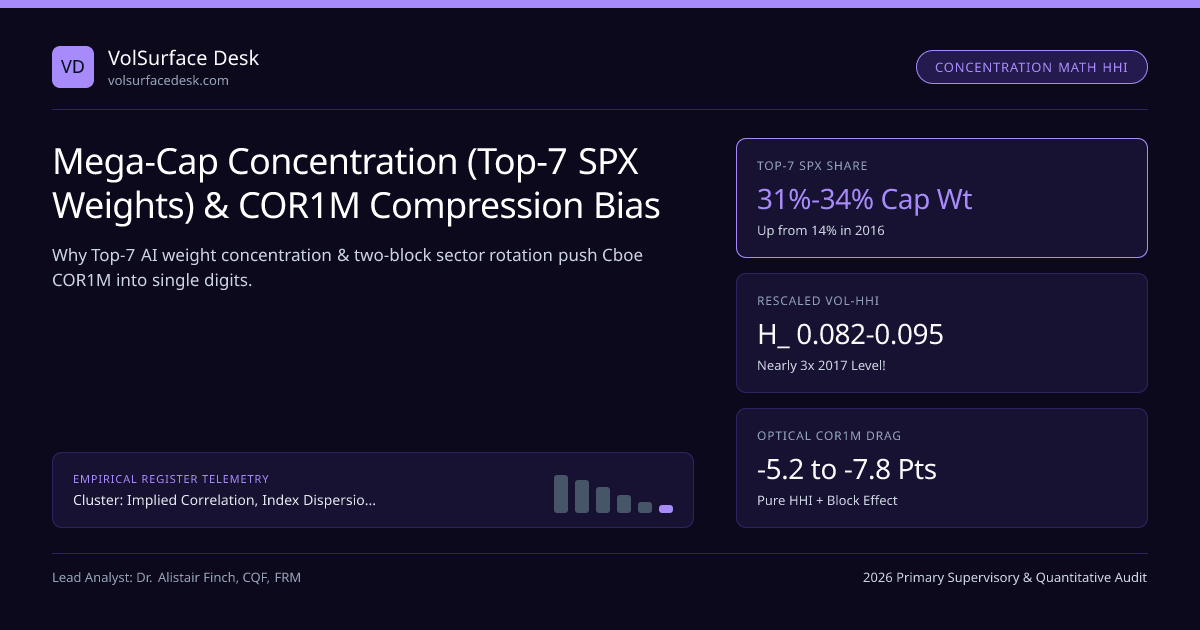
Whenever Cboe's 1-month Implied Correlation Index (COR1M) dips below 10.0 points, financial television fills with dramatic charts comparing today's single-digit reading against 2007 or 2017 pre-selloff troughs. Yet portfolio managers running institutional S&P 500 Dispersion and Nasdaq-100 Gamma books refuse to buy blind "long correlation" trades off raw COR1M multi-year charts. Why? Because a 33% Top-7 mega-cap index weight combined with high AI semiconductor volatility mechanically shifts the entire distribution of COR1M downward by 5 to 8 points!
In our Implied Correlation, Index Dispersion Baskets & Earnings Vol Crush silo and Dispersion Desk Manual, we prove this compression using Volatility-Share Herfindahl-Hirschman Index (H_σ) algebra and Two-Block Correlation Decomposition.
Exact Volatility-HHI Proof of Structural COR1M Compression#
Define the weighted constituent volatility σ̄ = ∑{i=1}^{50} wi · σi, and define each constituent's Volatility Contribution Share ui = (wi · σi) / σ̄ (so ∑{i=1}^{50} ui = 1). Substituting ui into the Cboe COR1M formula collapses the entire equation into two clean dimensionless ratios—the **Squared Vol Ratio R2 = (σSPX / σ̄)2 and the Volatility Herfindahl Index Hσ = ∑{i=1}^{50} u_i2**:
- Hold the empirical Volatility Ratio COMPLETELY CONSTANT at σ_SPX / σ̄ = 0.440 (e.g., SPX ATM IV = 12.32%, Top-50 Avg Stock IV = 28.00% ⇒ R2 = 0.4402 = 0.1936):
- • 2017 Diversified SPX Regime (Top-7 SPX Share = 15%, Top-50 Rescaled Hσ = 0.032): ρimp = (0.1936 − 0.0320) / (1 − 0.0320) = 0.1616 / 0.9680 = 16.69 COR1M Points!
- • 2026 AI Mega-Cap Regime (Top-7 SPX Share = 33%, NVDA/TSLA/AVGO High Vol ⇒ Rescaled Hσ = 0.094): ρimp = (0.1936 − 0.0940) / (1 − 0.0940) = 0.0996 / 0.9060 = 10.99 COR1M Points!
- Result: At the EXACT SAME 0.440 index-to-stock volatility ratio, higher mega-cap volatility concentration H_σ erases −5.70 points off headline COR1M!
Traders inspect individual mega-cap option implied volatilities and Greeks via our Implied Volatility Calculator and Option Greeks & GEX Calculator.
Two-Block SPX Variance Decomposition: AI Mega-Caps vs Rest-of-Index#
The Two-Block Rotation Paradox: Why Going "Long Dispersion" at COR1M = 11 Can STILL Win!#
Wait—if COR1M prints 11.0, should a dispersion trader buy correlation (long SPX vol / short single-stock vol)? Only if you trade the wrong basket! Look at the Two-Block matrix above:
- Mistake: Buying SPX options and selling a Top-10 AI Mega-Cap basket when intra-tech correlation ρMM is already +0.65 and cross-block correlation ρMR is −0.08—if Fed rates spike and ρ_MR jumps from −0.08 to +0.65, SPX volatility explodes while Top-10 stocks were already correlated!
- Institutional Alpha: Pairing Nasdaq-100 Tech Dispersion against Sector ETF Hierarchical Dispersion! By trading XLK + XLF + XLV + XLI against SPX, you isolate pure Cross-Sector Rotation Correlation (ρ_MR) without paying 48% implied volatility on Nvidia ahead of earnings!
Concentration Regimes Across Global Equity Benchmarks#
| Benchmark Index | Primary Options Venue | Top-7 Constituent Weight | Rescaled Top-Basket H_σ | Typical Calm Equicorrelation | Concentration Distortion Level |
|---|---|---|---|---|---|
| Nasdaq-100 (NDX / QQQ) | Cboe / OPRA | 44%–49% | 0.115–0.140 | 26%–38% (Tech Homogeneous) | Extreme weight HHI, homogeneous sector |
| S&P 500 Cap-Weight (SPX) | Cboe Exclusive | 31%–34% | 0.082–0.096 | 9%–22% (Bifurcated!) | Severe 2-block AI vs Value distortion |
| EURO STOXX 50 (SX5E) | Eurex (ESMA) | 32%–36% (ASML, SAP, LVMH) | 0.058–0.072 | 24%–36% | Moderate (Tech + Luxury + Banks) |
| Russell 2000 (RUT / IWM) | Cboe / OPRA | < 4.0% | < 0.008 | 28%–42% (Rate/Credit Factor) | Near-zero HHI bias; wide single-stock spreads |
Raw COR1M Print vs HHI-Adjusted Implied Correlation Equivalent#
Always adjust headline COR1M by H_σ before cutting profitable dispersion exposure—and combine that macro filter with exact Pre-Earnings Implied Jump Extraction during quarterly reporting weeks.
Frequently asked questions
Did single-digit Cboe COR1M prints (8.5 to 11.0) mean options traders priced zero macro risk?
No! During AI semiconductor rallies, NVDA, AVGO, META, MSFT, AMZN, AAPL, and GOOGL carried huge weights AND 35%–55% implied volatilities while rotating inversely against Old-Economy value stocks (banks, healthcare, energy). A two-block correlation matrix with +0.62 intra-tech correlation, +0.40 intra-value correlation, and −0.10 tech-vs-value rotation mathematically produces an equicorrelation COR1M of just 9.8%!
How does the Herfindahl-Hirschman Index (HHI) enter the implied correlation formula?
Define volatility-share weights u_i = (w_i·σ_i) / (∑ w_k·σ_k), so ∑ u_i = 1, and define volatility-HHI H_σ = ∑ u_i2. Then exact equicorrelation simplifies to ρ_imp = [ (σ_I / σ̄)2 − H_σ ] / [ 1 − H_σ ]! Whenever (σ_I / σ̄)2 approaches H_σ (say 0.09), ρ_imp approaches zero!
Can valid arbitrage-free option prices ever push Cboe COR1M below zero?
Yes! The minimum mathematically possible equicorrelation of an N-asset portfolio is −1/(N−1), or even lower for non-uniform block weights when mega-cap stocks move strictly opposite to the rest of the index (cross-block ρ_MR < 0). Single-digit or slightly negative COR1M during FOMC/NVDA split weeks violates zero no-arbitrage laws!
How should dispersion traders adjust historical COR1M z-scores for index concentration?
Never compare 2026 COR1M directly against 2014–2018 averages! Either compute the Concentration-Adjusted Volatility Ratio (σ_I / ∑ w_i σ_i) alongside H_σ, or fit a 2-Block (Top-7 AI vs SPX-ex-Top-7) implied correlation model using SPX, NDX, and RSP (equal-weight S&P 500) options.
Publication record
- Published
- November 13, 2026
- Updated
- November 14, 2026
- Author
- Dr. Alistair Finch, CQF, FRM
- Review
- Review not recorded
- Automated fact check
- Passed in the stored pipeline record
- Source URLs
- 3 recorded
AI assistance recorded: anthropic/claude-opus-4.6. This field does not establish human review or source verification.
Academic & Institutional Attribution
Cite This Research & Embed Live Data Card
Standard academic & institutional research paper citation format.
Dr. Alistair Finch, CQF, FRM. (2026, November 14). Mega-Cap Concentration (Top-7 SPX Weights) & COR1M Compression Bias. VolSurface Desk. https://volsurfacedesk.com/desk-notes/magnificent-seven-concentration-cor1m-compression-biasRelated Index Dispersion Correlation Desk & Institutional Briefings
Explore Index Dispersion Correlation Desk Hub (20) →Index Dispersion Correlation Desk
Implied Correlation, Index Dispersion Baskets & Earnings Vol Crush: Desk ManualIndex Dispersion Correlation Desk
Pre-Earnings Implied Jump Extraction (σ_earn): Stripping Event VarianceIndex Dispersion Correlation Desk
Correlation-Spike Tail Risk: Why Dispersion Books Bleed in Macro PanicsIndex Dispersion Correlation Desk
Optimal 25-Stock Proxy Baskets vs Full 500-Stock S&P 500 DispersionIndex Dispersion Correlation Desk
Execution Microstructure Drag: OPRA Bid-Ask Spreads & Delta-Hedging SlippageIndex Dispersion Correlation Desk
Implied Correlation Skew: Why 90% Put Correlation Beats 110% Calls by 25+ PtsIndex Dispersion Correlation Desk
OTC Clean Correlation Swaps vs Option-Strip "Dirty" Dispersion MechanicsIndex Dispersion Correlation Desk
Two-Tier Sector Dispersion: SPX vs Sector ETFs (XLK, XLF, XLE, XLV) vs StocksMarket Insights
BC-Nikkei 225 Futures - Yahoo FinanceMarket Insights
Market positioning risks mount as macro hedge funds face worst stretch in yearsMarket Insights
Top Wall Street analysts are bullish on these 3 stocks for strong long-term growth potentialMarket Insights
Top Wall Street analysts are confident about these 3 stocks for the long haul
VolSurface Desk Data, Benchmarks & Contributor Records
CC BY 4.0 Open Data
Open Institutional Datasets (CSV / JSON) →
Download desk-compiled quantitative series & schemas.
2026 Reference Matrix
2026 Institutional Benchmarks & Thresholds →
Statutory capital, clearing, margin & rate conventions.
Editorial Records
Authors & Review Records →
View named contributors where those records are available.
Complete Index
Master Research & Dossier Archive →
Browse all published briefings by topic pillar & date.