
Index Dispersion Correlation Desk
Pre-Earnings Implied Jump Extraction (σ_earn): Stripping Event Variance
Four times a year, single-stock weekly implied volatilities surge to 65%–110% ahead of quarterly earnings reports while SPX implied volatility barely budges. Derive the exact additive total-variance extraction formula for σ_earn.
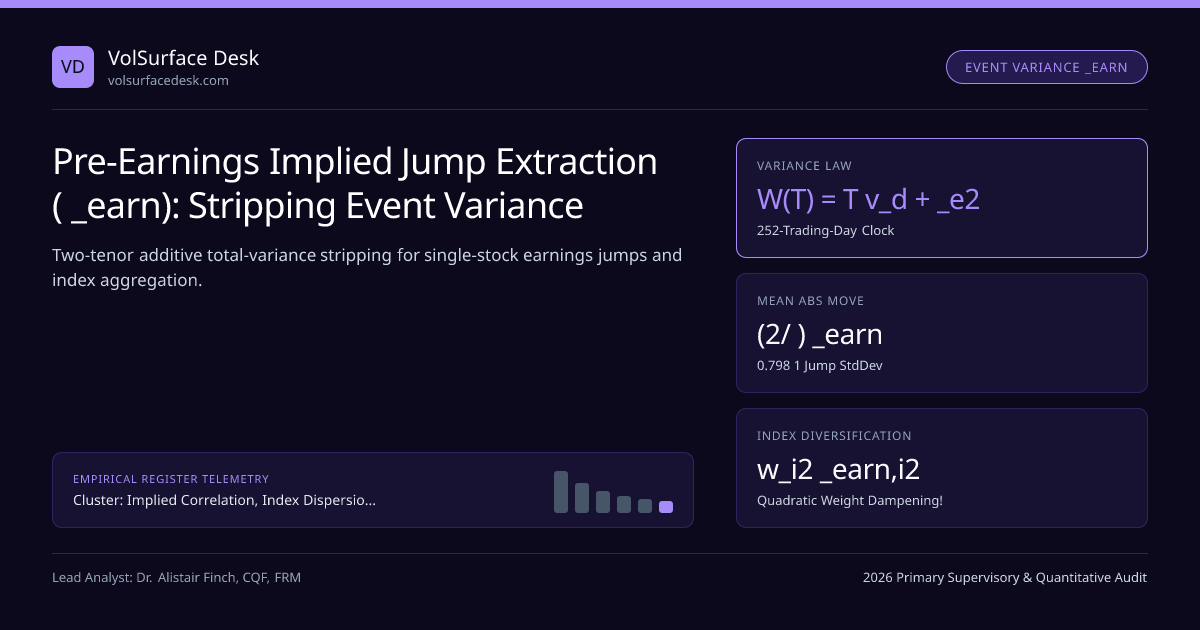
During the third week of January, April, July, and October, single-stock weekly options on companies like Netflix, Meta, Tesla, and Nvidia routinely trade at 70% to 115% annualized implied volatility, while 5-day Cboe SPX Weeklys trade calmly at 13.5%. For an institutional Index Dispersion trader, guessing whether 82% Friday implied volatility on Meta is "expensive" or "cheap" without stripping out baseline diffusive variance is impossible. You must extract the exact Implied Earnings Jump Standard Deviation (σ_earn).
Within our Implied Correlation, Index Dispersion Baskets & Earnings Vol Crush silo and Dispersion Desk Manual, this note derives the institutional Two-Tenor Forward Variance Stripper and proves how individual corporate jumps aggregate into S&P 500 and Nasdaq-100 index chains.
Exact Two-Tenor Additive Total-Variance Extraction of σ_earn#
Work strictly in business/trading days (Nbus = 252 days/year, excluding weekends and exchange holidays, or weighting non-event trading days at 1.0 and weekends at 0.15). Let expiration 1 have D1 effective trading days remaining and expiration 2 have D2 > D1 effective trading days remaining, where both D1 and D2 occur AFTER the scheduled earnings release (and no second earnings event falls between D1 and D2). Total cumulative variance W(Dk) = (Dk / 252) · σATM2(Dk) decomposes linearly:
- Where W(Dk) = (Dk / 252) · σk2 is cumulative dimensionless variance to expiry k, vdiff is daily diffusive variance, and σdiffann = √(252 · v_diff) is ex-earnings annualized volatility!
- Worked Live Example — Nvidia (NVDA) Ahead of Wednesday AMC Earnings (Evaluated Monday Noon: D1 = 4.5 trading days to Friday expiry at σ1 = 78.40%; D2 = 14.5 trading days to 2-week expiry at σ2 = 51.90%):
- 1) Cumulative Variances: W(4.5) = (4.5 / 252) × 0.78402 = 0.010976; W(14.5) = (14.5 / 252) × 0.51902 = 0.015501.
- 2) Daily Diffusive Variance: vdiff = (0.015501 − 0.010976) / (14.5 − 4.5) = 0.0004525/day ⇒ Ex-Earnings Annualized Vol σdiff = √(252 × 0.0004525) = 33.77%!
- 3) Pure Earnings Jump: σ_earn = √[ 0.010976 − 4.5 × 0.0004525 ] = √[ 0.008940 ] = ±9.455% (1σ Gaussian StdDev) ⇒ Implied Mean Absolute Gap E[|Jump|] = 0.7979 × 9.455% = ±7.54%!
Traders verify ATM straddle dollar premiums and post-print implied volatility collapse targets directly in our Black-Scholes Calculator, Implied Volatility Calculator, and 0DTE Expected Move Calculator.
Pre-Earnings Implied Jump Extraction & Dispersion Screening Pipeline#
Why Earnings Jumps Diversify Quadratically Out of S&P 500 Variance!#
Here is the mathematical engine that powers quarterly dispersion desks: suppose two companies i and j report purely idiosyncratic earnings surprises εi and εj (with zero cross-company earnings surprise correlation, Cov(εi, εj) ≈ 0, aside from shared sector read-throughs like AMD/NVDA or META/GOOGL). How much jump variance enters the S&P 500 index?
- Constituent Basket Leg: Receives the linear weighted sum ∑ wi · σearn,i2!
- S&P 500 Index Leg: Receives only the quadratically attenuated sum ∑ wi2 · σearn,i2 + ∑{i≠j ∈ same sub-sector} wi wj ρreadthrough σearn,i σearn,j!
Even for Nvidia at a massive w_NVDA = 6.8% SPX weight, wNVDA2 = 0.004624! A ±9.46% single-stock earnings jump (σearn2 = 0.00894) contributes just 0.004624 × 0.00894 = 0.0000413 to cumulative SPX variance—barely ±0.64% of one-time SPX move! For a 0.8% weight constituent (like Netflix or Caterpillar), w_i2 = 0.000064—its ±10% earnings jump is 99.99% diversified away inside SPX!
Representative Earnings Jump Profiles Across S&P 500 Tiers#
| Constituent Archetype | Typical SPX Weight (w_i) | Ex-Earnings Diffusive IV | Pre-Earnings Weekly IV (4.5d) | Extracted 1σ Jump (σ_earn) | Index Variance Leak (wi2 · σearn2) |
|---|---|---|---|---|---|
| AI Semiconductor Bellwether (NVDA, AVGO) | 2.2% – 7.0% | 32% – 38% | 72% – 88% | ±8.5% to ±10.5% | Noticeable (+0.4v to +0.8v on SPX; +1.8v on NDX) |
| Mega-Cap Platform (MSFT, AAPL, GOOGL, AMZN) | 4.0% – 7.3% | 20% – 26% | 42% – 58% | ±4.2% to ±6.8% | Moderate (+0.2v to +0.5v when clustered) |
| High-Beta Consumer / Streaming (NFLX, TSLA) | 0.9% – 2.1% | 34% – 48% | 78% – 105% | ±9.2% to ±12.4% | Tiny (< 0.08v on SPX; pure dispersion fuel!) |
| Large-Cap Financials / Healthcare (JPM, UNH, LLY) | 1.1% – 1.8% | 17% – 24% | 34% – 48% | ±3.6% to ±5.8% | Negligible (< 0.03v on SPX) |
Implied Volatility Term-Structure Kink Ahead of a ±9.46% Earnings Print#
Once earnings hit the tape at 16:05 ET and weekly implied volatility collapses by 40+ vol points the next morning, desks transition immediately to our sibling playbook on Post-Earnings Volatility Crush & PEAD Diagonal Spreads. Compare live parameters in Dispersion Correlation-Spike Tail Risk & Crash Hedging.
Frequently asked questions
Why must you divide annualized implied variance by 252 trading days (not 365 calendar days) when extracting σ_earn?
Equity volatility accrues overwhelmingly during regular and extended trading sessions rather than quiet weekends! Dividing annualized σ2 by 365 understates daily diffusive variance by 31% (252/365 = 0.69), artificially inflating your extracted earnings jump σ_earn on Tuesday-through-Thursday expirations.
How does the Options Market Maker ATM Straddle rule (±0.80 × Straddle %) compare to exact variance-extracted σ_earn?
For an option expiring the Friday immediately after a Thursday after-market-close (AMC) earnings print (T1 ≈ 1 trading day left), Total Straddle ≈ √(2/π) · S · √(σ_diff2 + σ_earn2) ≈ 0.7979 · S · σ_earn! Thus Straddle % / 0.7979 gives 1σ standard deviation, while raw Straddle % (~0.80σ) equals the Expected Mean Absolute Deviation E[|ΔS/S|]!
Why can two weekly expiries T1 and T2 occasionally produce a negative extracted σ_earn2—and what causes it?
If T1 spans earnings while T2 ALSO spans a major macro FOMC/CPI event or a second product launch (like Apple WWDC or Nvidia GTC), then diffusive/macro variance between T1 and T2 exceeds baseline σ_diff2, biasing (T2σ22 − T1σ12)/(T2−T1) upward! Always subtract known FOMC/CPI macro variance weights from SPX/QQQ first.
How much does Peak Tech Earnings Week lift Nasdaq-100 (NDX) and S&P 500 (SPX) weekly implied volatility?
Suppose MSFT (7.0% SPX wt, σ_earn = ±5.2%), AAPL (7.2% wt, ±4.5%), META (2.8% wt, ±8.5%), AMZN (4.1% wt, ±6.8%), and GOOGL (4.2% wt, ±6.0%) all report in one week: ∑ w_i2·σ_earn,i2 ≈ 0.000435, which adds √(252/5 × 0.000435) ≈ +4.7% annualized variance—lifting 5-day SPX IV from 13.0% to ~13.8%, and NDX IV (where weights are 1.5× larger!) from 17.0% to ~19.4%!
Publication record
- Published
- November 13, 2026
- Updated
- November 14, 2026
- Author
- Dr. Alistair Finch, CQF, FRM
- Review
- Review not recorded
- Automated fact check
- Passed in the stored pipeline record
- Source URLs
- 3 recorded
AI assistance recorded: anthropic/claude-opus-4.6. This field does not establish human review or source verification.
Academic & Institutional Attribution
Cite This Research & Embed Live Data Card
Standard academic & institutional research paper citation format.
Dr. Alistair Finch, CQF, FRM. (2026, November 14). Pre-Earnings Implied Jump Extraction (σ_earn): Stripping Event Variance. VolSurface Desk. https://volsurfacedesk.com/desk-notes/pre-earnings-implied-jump-variance-extraction-sigma-earnRelated Index Dispersion Correlation Desk & Institutional Briefings
Explore Index Dispersion Correlation Desk Hub (20) →Index Dispersion Correlation Desk
Implied Correlation, Index Dispersion Baskets & Earnings Vol Crush: Desk ManualIndex Dispersion Correlation Desk
Correlation-Spike Tail Risk: Why Dispersion Books Bleed in Macro PanicsIndex Dispersion Correlation Desk
Optimal 25-Stock Proxy Baskets vs Full 500-Stock S&P 500 DispersionIndex Dispersion Correlation Desk
Execution Microstructure Drag: OPRA Bid-Ask Spreads & Delta-Hedging SlippageIndex Dispersion Correlation Desk
Implied Correlation Skew: Why 90% Put Correlation Beats 110% Calls by 25+ PtsIndex Dispersion Correlation Desk
OTC Clean Correlation Swaps vs Option-Strip "Dirty" Dispersion MechanicsIndex Dispersion Correlation Desk
Two-Tier Sector Dispersion: SPX vs Sector ETFs (XLK, XLF, XLE, XLV) vs StocksIndex Dispersion Correlation Desk
Post-Earnings Volatility Crush & PEAD Calendar / Diagonal Option SpreadsMarket Insights
Market positioning risks mount as macro hedge funds face worst stretch in yearsMarket Insights
Top Wall Street analysts are bullish on these 3 stocks for strong long-term growth potentialMarket Insights
Top Wall Street analysts are confident about these 3 stocks for the long haulMarket Insights
Top Wall Street analysts are bullish on the growth potential of these 3 stocks
VolSurface Desk Data, Benchmarks & Contributor Records
CC BY 4.0 Open Data
Open Institutional Datasets (CSV / JSON) →
Download desk-compiled quantitative series & schemas.
2026 Reference Matrix
2026 Institutional Benchmarks & Thresholds →
Statutory capital, clearing, margin & rate conventions.
Editorial Records
Authors & Review Records →
View named contributors where those records are available.
Complete Index
Master Research & Dossier Archive →
Browse all published briefings by topic pillar & date.