
Index Dispersion Correlation Desk
Execution Microstructure Drag: OPRA Bid-Ask Spreads & Delta-Hedging Slippage
A backtest built on OPRA end-of-day mid-prices shows +9.0 correlation points of dispersion alpha; live execution with naive hourly delta-hedging nets +1.5 points! Derive exact Leland volatility adjustments and Whalley-Wilmott optimal hedge bands.
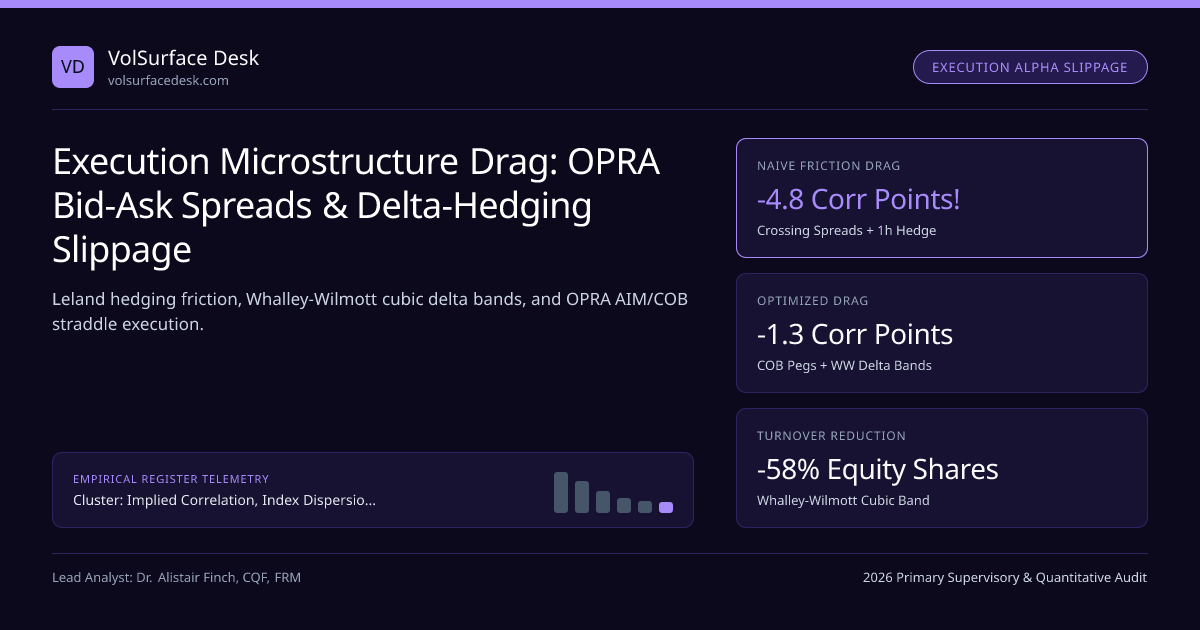
Every multi-strategy CIO has rejected a pitch deck showing a 3.8 Sharpe ratio on historical S&P 500 dispersion for the exact same reason: paper dispersion backtests evaluate OPRA closing mid-quotes and frictionless Black-Scholes delta hedging. In live production across Cboe and the 18 US equity options exchanges on OPRA, an execution-blind trader loses 4.5 to 6.0 correlation points to option bid-ask spreads and over-frequent cash-equity delta rehedging!
Within our Implied Correlation, Index Dispersion Baskets & Earnings Vol Crush silo and Dispersion Desk Manual, quantifying Leland Volatility Slippage and deploying Whalley-Wilmott Cubic No-Trade Bands transforms raw theoretical correlation edge into net realized fund returns.
Exact Total Dispersion Friction Budget: Entry Spreads + Leland Gamma Drag#
Remember the cardinal rule of option transaction costs proved by Hayne Leland (1985): proportional underlying hedging cost k (half bid-ask spread + market impact) ALWAYS works against you regardless of whether you are Long Gamma or Short Gamma! On a long S&P 500 Dispersion book, it subtracts from single-stock volatility gained and adds to SPX volatility owed:
- Whalley-Wilmott (1997) Optimal Delta No-Trade Half-Width (in shares Δband around Black-Scholes ΔBS, with risk aversion λ_A):
- Δband,i = [ (3 · e^(−rT) · kS,i · Si · Γi2) / (2 · λA) ]^(1/3) — Rehedge ONLY when |Δactual − ΔBS| > Δband,i, and trade just to the band edge!
- Worked 63-Day Dispersion Friction Audit (σI = 14.0%, σS = 28.0%, Raw Implied ρ = 25.0%, Realized ρ = 16.0% ⇒ +9.00 Corr Pts Gross Edge):
- • Naive Execution (Cross full 1.15v OPRA straddle spread + hourly Δt = 1/1638 yr equity hedging at kS = 3.5 bps): Δσeff,S = −1.15v − 0.96v = −2.11v (28% → 25.89%); SPX cost = +0.28v ⇒ Effective ρ hurdle jumps from 16.0% to 21.8% (-5.80 Corr Pts lost to friction!!).
- • Institutional Execution (OPRA COB Vol-Pegged Auctions = 0.36v entry + Twice-Daily Whalley-Wilmott Bands + VWAP/MOC Internalization at k_S = 1.1 bps): Total friction drops to −1.32 Corr Pts ⇒ Net Harvested Edge = +7.68 Corr Pts!
Traders translate cent bid-ask widths on single-stock straddles into exact implied-volatility bps using our Implied Volatility Calculator and monitor live portfolio Gamma/Delta bands in the Option Greeks & GEX Calculator.
Institutional Dispersion Execution & Whalley-Wilmott Hedging Engine#
Pro Tip: Hold Single-Stock Options to Expiration Instead of Paying Exit Option Spreads!#
Why pay the OPRA option bid-ask spread twice (once at 63 DTE entry and again at 14 DTE exit)? Notice that if you hold a 45-to-63 day dispersion basket all the way to Monthly OPEX Friday:
- SPX Index Leg (AM-Settled SPX or PM-Settled SPXW): Cash-settles automatically against the official SOQ or 16:00 ET print—zero option exit spread!
- Single-Stock Constituent Legs: Any out-of-the-money option expires worthless (zero exit cost), while any in-the-money call or put is closed solely via its underlying cash-equity share delta in the 16:00 ET NYSE/Nasdaq Market-on-Close (MOC) auction (costing ~0.8 bps of stock price vs 15–35 bps in an option spread!), subject only to pinning discipline on strikes within ±0.35% of spot at 15:45 ET!
Execution Method Comparison Across $100k Vega S&P 500 Dispersion Basket#
| Execution & Hedging Protocol | Option Entry + Exit Cost | Underlying Equity Hedge Drag | Total Correlation Point Drag | Net Retained Alpha (Out of +9.0 Pts) |
|---|---|---|---|---|
| Aggressive Market Sweep + 15m Hedging | 1.90 Vol Pts (Cross Bid-Ask 2x) | 1.45 Vol Pts (Severe Leland Whip) | −7.4 Corr Pts | +1.6 Pts (Barely Break-Even!) |
| Mid-Pegged Entry + Fixed Daily Close Hedge | 0.85 Vol Pts | 0.52 Vol Pts | −3.1 Corr Pts | +5.9 Pts |
| OPRA COB Vol-Peg + Whalley-Wilmott + Hold-to-Expiry | 0.36 Vol Pts (Zero Exit Option Spread!) | 0.24 Vol Pts (MOC + Cubic Bands) | −1.3 Corr Pts | +7.7 Pts (85.6% Alpha Capture!) |
| OTC Single-Ticket Bank Dispersion Swap | All-in Bank Dealer Bid-Offer: 2.2 to 3.5 Corr Pts | 0.00 Vol Pts (Bank Absorbs Hedging!) | −2.8 Corr Pts | +6.2 Pts (Zero Operational Overhead) |
Cash-Equity Delta-Hedging Slippage vs Rebalancing Rule (63-Day Straddle)#
Notice the final row of our comparison table (OTC Bank Dispersion Swaps): why do pension funds and macro overlay desks willingly pay a dealer 2.8 correlation points for an OTC Correlation or Variance Dispersion Swap? Because listed ATM option strips suffer Strike Path Drift—which we dissect in Implied Correlation Skew and OTC Clean Correlation Swaps vs Dirty Option Dispersion.
Frequently asked questions
Why is end-of-day OPRA mid-quote backtesting notoriously deceptive for single-stock dispersion?
At 15:59:55 ET right before the closing bell, OPRA market makers widen displayed single-stock option quotes dramatically to protect against closing auction imbalances! Furthermore, backtests assume zero cost on opening/closing straddles AND zero bid-ask/market-impact cost on 60+ days of constituent stock delta hedges—overstating net returns by 300 to 550 bps/year!
Should you execute the SPX index leg first or the 32 single-stock legs first when entering a dispersion basket?
Execute the harder-to-fill single-stock volatility legs FIRST via volatility-pegged auto-quoters across OPRA exchanges, streaming dynamic ES futures delta hedges as each stock fills—and execute the ultra-liquid Cboe SPX straddle or OTC variance leg LAST (or in 25% tranches as basket vega crosses 25%, 50%, 75%, 100%)!
Why does Leland’s transaction-cost volatility adjustment hurt BOTH the long stock leg and the short index leg?
When you are LONG single-stock Gamma, you buy stock after dips and sell after rallies—paying half-spread k_s on every round-trip scalp, which SUBTRACTS from your realized volatility! When you are SHORT SPX Gamma, you buy ES futures after rallies and sell after dips—ALSO paying half-spread k_I on every hedge, which ADDS to the effective volatility you owe! Friction never cancels across opposite Gamma signs!
How often should an institutional dispersion desk delta-hedge single-stock legs vs the SPX leg?
Continuous 5-minute delta hedging is suicide—it maximizes Leland √(1/Δt) friction and gets whipped by intraday mean-reversion! Institutional desks check Whalley-Wilmott delta-band breaches twice daily (around 10:30 ET after opening noise clears and 15:45 ET into MOC liquidity), or cross internal house equity flow at mid-point.
Publication record
- Published
- November 13, 2026
- Updated
- November 14, 2026
- Author
- Dr. Alistair Finch, CQF, FRM
- Review
- Review not recorded
- Automated fact check
- Passed in the stored pipeline record
- Source URLs
- 3 recorded
AI assistance recorded: anthropic/claude-opus-4.6. This field does not establish human review or source verification.
Academic & Institutional Attribution
Cite This Research & Embed Live Data Card
Standard academic & institutional research paper citation format.
Dr. Alistair Finch, CQF, FRM. (2026, November 14). Execution Microstructure Drag: OPRA Bid-Ask Spreads & Delta-Hedging Slippage. VolSurface Desk. https://volsurfacedesk.com/desk-notes/single-stock-bid-ask-spread-delta-hedging-drag-dispersionRelated Index Dispersion Correlation Desk & Institutional Briefings
Explore Index Dispersion Correlation Desk Hub (20) →Index Dispersion Correlation Desk
Implied Correlation, Index Dispersion Baskets & Earnings Vol Crush: Desk ManualIndex Dispersion Correlation Desk
Implied Correlation Skew: Why 90% Put Correlation Beats 110% Calls by 25+ PtsIndex Dispersion Correlation Desk
OTC Clean Correlation Swaps vs Option-Strip "Dirty" Dispersion MechanicsIndex Dispersion Correlation Desk
Two-Tier Sector Dispersion: SPX vs Sector ETFs (XLK, XLF, XLE, XLV) vs StocksIndex Dispersion Correlation Desk
Post-Earnings Volatility Crush & PEAD Calendar / Diagonal Option SpreadsIndex Dispersion Correlation Desk
Equity Repo & Hard-to-Borrow Short-Fee Spikes in Single-Stock DispersionIndex Dispersion Correlation Desk
Nasdaq-100 (NDX / VXN) Tech & Semiconductor Dispersion vs S&P 500Index Dispersion Correlation Desk
Worst-of Basket Autocallable Notes: Structured-Product Correlation SupplyMarket Insights
Top Wall Street analysts are bullish on the growth potential of these 3 stocksMarket Insights
Equity Dispersion Trade Risks a Blowup, Hedge Fund CEO Warns - Bloomberg.comMarket Insights
Traders bet on a pop for Anthropic's historic IPOMarket Insights
A massive trade in Nvidia just went off – here are the details
VolSurface Desk Data, Benchmarks & Contributor Records
CC BY 4.0 Open Data
Open Institutional Datasets (CSV / JSON) →
Download desk-compiled quantitative series & schemas.
2026 Reference Matrix
2026 Institutional Benchmarks & Thresholds →
Statutory capital, clearing, margin & rate conventions.
Editorial Records
Authors & Review Records →
View named contributors where those records are available.
Complete Index
Master Research & Dossier Archive →
Browse all published briefings by topic pillar & date.