
Extracting Implied Forward and Borrow Rates Before Volatility Surface Fitting
A mere 15 bps error in assumed forward price F_T splits call and put implied volatilities by 0.65 vol points near ATM, ruining SVI calibration unless parity-cleaned.
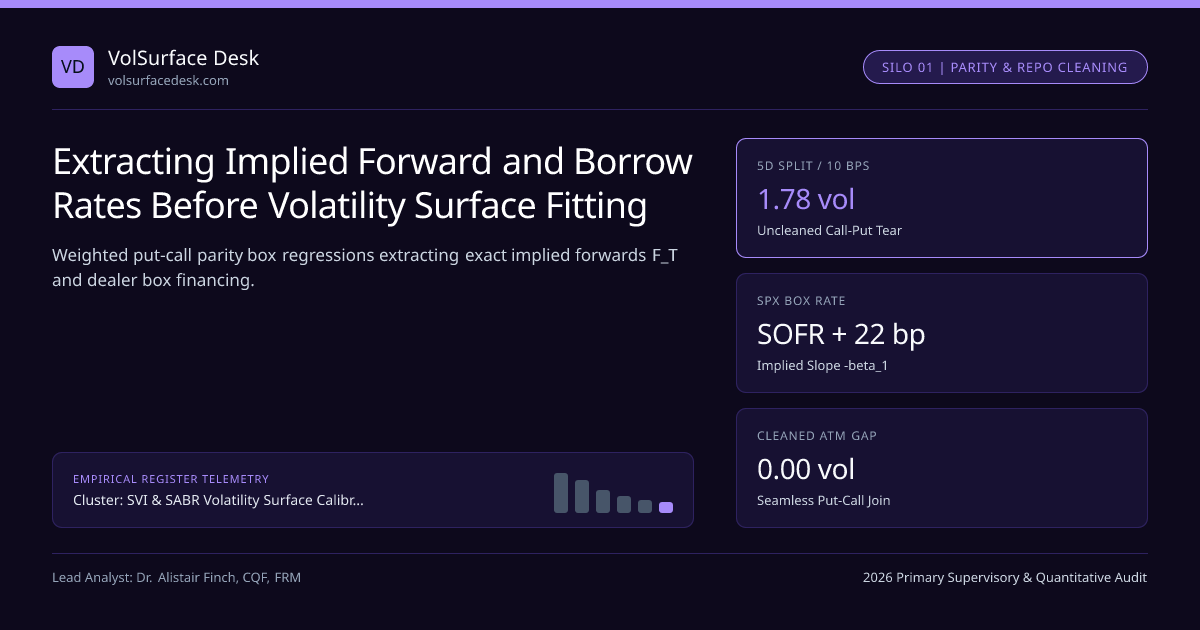
Feed an afternoon SPX option snapshot into an implied volatility calculator using raw cash S&P 500 spot S0 plus a generic Treasury yield—ignoring equity repo financing spreads and index dividend accruals—and plotted call and put implied volatilities split into two diverging curves crossing at ATM! On a 14-DTE option slice, misestimating the forward price F_T by just 15 basis points (8.75 SPX index points at 5,840) opens a 0.65-vol-point gap between ATM calls and ATM puts, fooling any optimizer into inventing phantom skew. Within our SVI & SABR Volatility Surface Calibration & No-Arbitrage Conditions workflow, every volatility calibration begins with box-spread and put-call parity forward extraction, cross-referenced directly with our Futures Fair Value & Basis Calculator.
European Put-Call Parity Linear Regression Across Near-ATM Strikes#
For European index options (such as SPX, NDX, RUT, and SX5E), exact model-free put-call parity holds at every strike K inside expiration T: Cmid(K, T) − Pmid(K, T) = D(0, T) × (FT − K) = D(0, T)·FT − D(0, T)·K
Notice that plotting yi = Cmid(Ki) − Pmid(Ki) against strike xi = Ki across the 8 to 14 liquid strikes within ±2.5% of ATM defines a straight line whose slope β1 = −D(0, T) simultaneously reveals the option-market implied discount factor (box rate!) and whose intercept β0 = D(0, T)·FT yields the exact market-implied forward F_T = −β0 / β1!
Put-Call Parity Forward & Box-Rate Extraction Pipeline#
Quantifying the Implied Volatility Split From Forward Mispricing#
Why is implied volatility near ATM hyper-sensitive to tiny forward errors ΔF = Fwrong − Ftrue? Because Black-76 call price increases by +0.50·D·ΔF while put price decreases by −0.50·D·ΔF, whereas ATM vega equals D·F·√(T / 2π) ≈ 0.3989·D·F·√T. Dividing opposite-sign price errors ±0.5·D·ΔF by ATM vega produces an exact inverse-square-root explosion in call-minus-put implied volatility gap as T → 0:
- Weighted Parity Box Regression: Ci − Pi = β0 + β1·Ki, weights wi = 1 / [(Cask − Cbid)2 + (Pask − Pbid)2].
- Exact Recovery: Dbox(0, T) = −β1 = exp(−rbox·T), Fimp(T) = −β0 / β1, Implied Repo rrepo − qdiv = (1/T)·ln(Fimp / S0).
- Worked 5-DTE SPX Example (S0 = 5,850.00, T = 5/252 = 0.01984 yr, True F_imp = 5,853.80, Uncleaned Spot Used ΔF = −3.80 => −6.50 bps):
- Induced Call-Put IV Gap: −2.5066 × (−0.000649) / √0.01984 = +0.01155 => ATM Calls print +1.16 vol points ABOVE ATM Puts until F_imp is applied!
Look at how dramatic that formula is on 1-DTE and 0DTE index slices: at 2 trading hours remaining (T = 1 / (252 × 3.25) = 0.00122 yr), √T = 0.0349, so even a 2-point ES/SPX basis lag creates a 2.45-vol-point tear right through the center of the volatility smile! Desks eliminate that tear instantly by anchoring intraday SPX 0DTE forwards to live CME E-mini S&P 500 (ES) micro-price adjusted for remaining cash basis in our Futures Fair Value & Basis Calculator.
Single-Stock Pinning Bounds for American Put-Call Parity#
For American single-stock options (addressed in de-Americanization under discrete cash dividends), exact equality becomes a double inequality due to early exercise, narrowing to a tight 3-to-8 bps corridor at the synthetic ATM strike where CAmer(K*) ≈ PAmer(K*). Regressing implied borrow fee q_borrow across expirations simultaneously reveals short-squeeze stress tracked by institutional equity financing desks.
| Underlying Type | Primary Forward Source | Discount Curve D(0, T) | Intraday Sync Anchor | Desk Tool / Reference |
|---|---|---|---|---|
| SPX European Index | 12-Strike WLS Parity Box | Implied SPX Box Rate (SOFR+22bp) | CME ES Futures + Basis | Futures Fair Value Tool |
| VIX Options (Cboe) | Liquid CFE VIX Futures (VX) | SOFR OIS Zero Curve | Direct VX Micro-Price | Cboe Counterparty |
| SOFR Swaptions | OIS Par Swap Curve F_swap | Multi-Curve SOFR Annuity A0 | Live CME SR3 Strip | Implied Vol Calculator |
| US Single-Stock Amer | Iterative Amer Parity Corridor | SOFR OIS + Stock Borrow q_b | Cash NBBO Mid + Div PV | FINRA Rule 4210 TIMS |
Box Spread Financing and Regulatory Margin Treatment#
Because SPX European box spreads lock in deterministic terminal payoff K2 − K1 cleared through OCC STANS margin under U.S. SEC and CFTC oversight, extracting β1 = −D_box(0, T) inside SVI & SABR Volatility Surface Calibration & No-Arbitrage Conditions simultaneously supplies the true dealer funding curve used across all vega-weighted SVI optimizers.
Frequently asked questions
Why should volatility surface optimizers discard in-the-money (ITM) calls and puts after extracting F_T?
High-delta ITM options carry 5x to 15x wider dollar bid-ask spreads due to market-maker delta-hedging inventory costs and lower vega per dollar of spread; once F_T is locked by parity, OTM options contain identical volatility information with far tighter bid-ask noise.
Why does the implied SPX box rate trade 15 to 25 bps above risk-free SOFR OIS?
Dealers borrowing cash via short SPX box spreads economize balance-sheet leverage versus bilateral Treasury repo while clearing centrally at OCC, creating a persistent equilibrium financing spread of SOFR + 15 to 25 bps.
What happens if you extract D_box(0, T) on an illiquid far-dated LEAPS slice with wide spreads?
On wide-spread slices with few tight pairs, unconstrained slope beta_1 can become noisy; production pipelines clamp D_box within SOFR OIS +- 35 bps and solve a 1-parameter WLS solely for intercept F_imp.
How are VIX option implied volatilities affected if you use spot VIX instead of VIX futures as the forward?
Catastrophically! VIX options settle into Wednesday morning SOQ VIX—whose forward expectation is the CFE VIX future (often 2 to 4 vol points above or below spot VIX)—not spot VIX, so using spot VIX destroys the entire VIX option smile.
Publication record
- Published
- November 14, 2026
- Updated
- November 14, 2026
- Author
- Dr. Alistair Finch, CQF, FRM
- Review
- Review not recorded
- Automated fact check
- Passed in the stored pipeline record
- Source URLs
- 3 recorded
AI assistance recorded: anthropic/claude-opus-4.6. This field does not establish human review or source verification.
Academic & Institutional Attribution
Cite This Research & Embed Live Data Card
Standard academic & institutional research paper citation format.
Dr. Alistair Finch, CQF, FRM. (2026, November 14). Extracting Implied Forward and Borrow Rates Before Volatility Surface Fitting. VolSurface Desk. https://volsurfacedesk.com/desk-notes/put-call-parity-implied-forward-repo-rate-surface-cleaningRelated Svi Sabr Smile Arbitrage Free & Institutional Briefings
Explore Svi Sabr Smile Arbitrage Free Hub (20) →Svi Sabr Smile Arbitrage Free
SVI and SABR Volatility Surface Calibration: 2026 Institutional No-Arbitrage GuideSvi Sabr Smile Arbitrage Free
Vega-Weighted Least Squares and Bid-Ask Penalty Splines in SVI OptimizersSvi Sabr Smile Arbitrage Free
Extended SSVI Term-Structure Rho Monotonicity Across Quarterly Listed OptionsSvi Sabr Smile Arbitrage Free
Breeden-Litzenberger Risk-Neutral Density Recovery and Pareto Wing TailsSvi Sabr Smile Arbitrage Free
Kalman Filter State-Space Updates for Intraday Arbitrage-Free Volatility GridsSvi Sabr Smile Arbitrage Free
Gatheral Raw SVI Five-Parameter Total Variance Fitting on SPX Listed OptionsSvi Sabr Smile Arbitrage Free
Natural SVI and SVI-Jump-Wings Parameter Mapping for Equity Options DesksSvi Sabr Smile Arbitrage Free
Surface SVI Power-Law Kernel Calibration Across Multi-Expiry Index OptionsDealer Gamma Vanna Charm Flows
Systematic Put-Write & Call-Overwrite ETFs (PUTW, XYLD, JEPI) Gamma SupplyDealer Gamma Vanna Charm Flows
Whalley-Wilmott Discrete Gamma Hedging Bandwidths Under ES Transaction CostsDealer Gamma Vanna Charm Flows
Single-Stock Call-Skew Inversion & Dealer Short-Call Gamma SqueezesDealer Gamma Vanna Charm Flows
0DTE Intraday Variance-Time Clock vs Wall-Clock Theta & Event Jumps
VolSurface Desk Data, Benchmarks & Contributor Records
CC BY 4.0 Open Data
Open Institutional Datasets (CSV / JSON) →
Download desk-compiled quantitative series & schemas.
2026 Reference Matrix
2026 Institutional Benchmarks & Thresholds →
Statutory capital, clearing, margin & rate conventions.
Editorial Records
Authors & Review Records →
View named contributors where those records are available.
Complete Index
Master Research & Dossier Archive →
Browse all published briefings by topic pillar & date.