
FX Risk Reversal Strangle Surfaces
FX 10-Delta Wing Butterflies vs 25-Delta Flies: Jump Kurtosis Pricing
Use the institutional BF_10 / BF_25 Wing Ratio to diagnose pure diffusive vol-of-vol (~3.1x–3.4x ratio) versus discontinuous central-bank / EM devaluation jump risk (> 4.2x ratio)—and avoid Durrleman butterfly arbitrage.
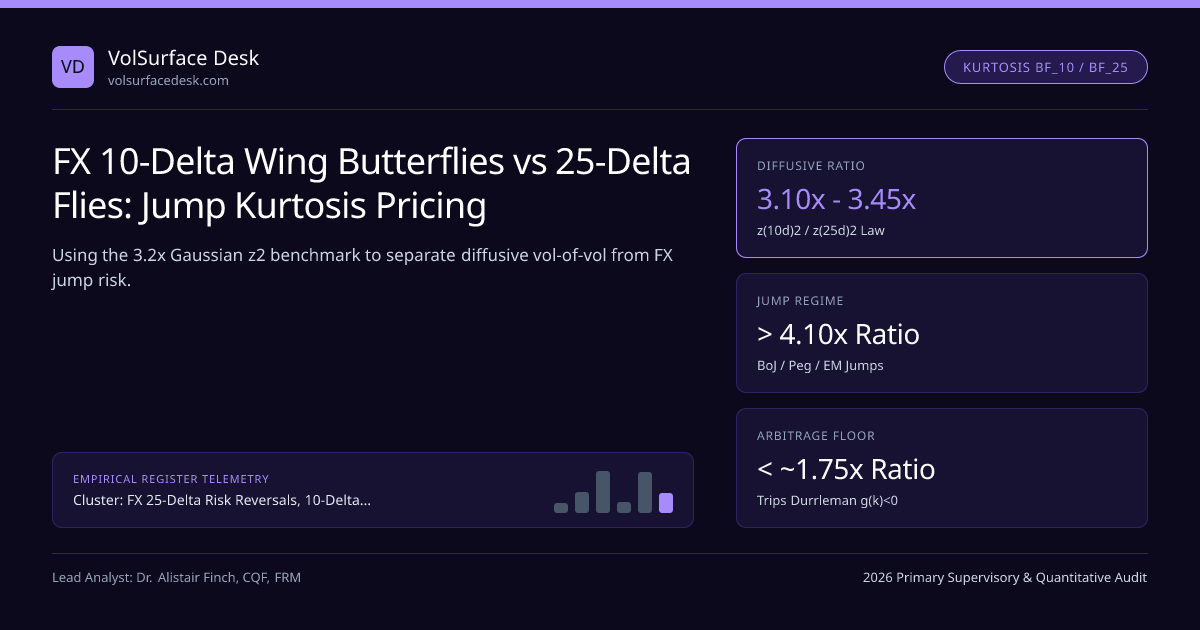
Why do interbank FX brokers quote both a 25-delta Butterfly (BF25) and a 10-delta Butterfly (BF10) at every maturity if a single vol-of-vol parameter (ν in SABR or η in Heston) already generates smile curvature? Because real currency markets suffer both continuous stochastic vol-of-vol and discontinuous central-bank / sovereign devaluation jumps!
Within the FX 25-Delta Risk Reversals, 10-Delta Butterflies & Event Vol Weights silo and our FX Volatility Surfaces & Event Vol Guide, the dimensionless Wing Curvature Ratio (Rfly = BF10 / BF_25) acts as an instant X-ray distinguishing calm diffusive smiles from jump-loaded fat tails (Vomma & Third-Order Greeks Benchmark).
Deriving the Theoretical 3.2× Diffusive Ratio vs Merton Jump Excess#
Near at-the-money log-moneyness k = ln(K/F), any smooth continuous stochastic-volatility smile expands as σ(k) ≈ σATM + α·k + 1⁄2·γcurv·k2. Substituting k(Δ) ≈ zN(Δ) · σ(Δ) · √T where zN(0.25) = 0.6745 (z2 = 0.455) and zN(0.10) = 1.2816 (z2 = 1.642), and adding a Merton Poisson jump intensity λJ with jump size variance s_J2 over short tenor T proves:
Quantitative Pricing Model: FX 10-Delta vs 25-Delta Butterflies & Jump Kurtosis Guide#
- Pure Continuous Diffusion Benchmark (λJ = 0): Rfly^diffusive ≈ (1.2816 / 0.6745)2 × (σ10 / σ25)_adj ≈ 3.15× to 3.45× !
- Short-Dated Jump Explosion (T → 1W): Diffusive curvature holds steady while Poisson jump probability λJ·T inflates deep 10d wings, driving Rfly → 4.2× to 6.0×!
- Worked 2-Week USD/JPY BoJ Intervention Diagnostic (Spot = 157.80, σATM = 10.20%, BF25 = +0.34%, BF_10 = +1.62%):
- Observed R_fly = 1.62 / 0.34 = 4.76× (vs 3.25× diffusive baseline => +0.51v pure intervention jump surcharge in 10d wings!). A Vomma-Neutral Switch (Short 1.0× 10d Fly vs Long 1.68× 25d Fly) harvests +0.51v if Ministry of Finance refrains from intervening!
Traders verify exact 10-delta vs 25-delta Black-Scholes Vomma ratios in our Black-Scholes Option Calculator and check implied break-evens in the Implied Volatility Calculator.
Wing Ratio (BF10 / BF25) Model Selection & Arbitrage Gate#

Typical BF25, BF10, and R_fly Across Global FX Regimes#
| Currency Pair & Tenor | BF_25 (Vol Pts) | BF_10 (Vol Pts) | Rfly = BF10 / BF_25 | Microstructure Driver |
|---|---|---|---|---|
| EUR/USD 3M (Calm G10) | +0.24v | +0.78v | 3.25× | Textbook continuous stochastic vol-of-vol |
| USD/JPY 2W (Near 160 MoF Zone) | +0.36v | +1.74v | 4.83× | Discrete 400-pip Tokyo intervention jump hazard! |
| EUR/CHF 1M (SNB Policy Floor) | +0.29v | +1.52v | 5.24× | Post-2015 SNB peg-break trauma priced in 10d CHF calls |
| USD/MXN 1M (Election / Tariff) | +0.68v | +2.95v | 4.34× | Gap devaluation jump tail via Vanna-Volga limits |
Term-Structure Decay of the Jump Ratio (BF10 / BF25) Across Tenors#

Notice how the Central Limit Theorem shapes the bars above: at 1-Week, a single jump creates massive 4.65× kurtosis (BF_10 ultra-rich), whereas by 2-Year, dozens of independent macro shocks aggregate toward diffusive 3.18× geometry! Compare live parameters in Overnight FX Central-Bank Event Variance Weights Guide.
Frequently asked questions
Why is the baseline continuous-diffusion ratio of 10-delta Butterfly to 25-delta Butterfly roughly 3.2x?
Near ATM, smile curvature scales with squared inverse-normal z-scores z(Δ)2! For Δ = 0.25, z(0.25) = 0.6745 => z2 = 0.455; for Δ = 0.10, z(0.10) = 1.2816 => z2 = 1.642! Dividing 1.642 / 0.455 gives 3.61x in fixed-vol z-space, which compresses slightly to ~3.15x–3.40x once higher 10d wing σ widens strike placement!
What causes the BF_10 / BF_25 ratio to exceed 4.5x on short-dated FX options?
Over short horizons (1W–1M), continuous Brownian vol-of-vol has almost no time (√T) to generate extreme tail outcomes, whereas a sudden 4% BoJ FX intervention or EM central-bank emergency rate move happens instantaneously! Merton jump-diffusion adds O(1/T) short-dated kurtosis exclusively into the 10d wings!
How do macro volatility funds trade the "10d vs 25d Wing Ratio Spread"?
To isolate pure tail jump risk with zero ATM Vega and zero first-order Vomma, desks trade a Vomma-Neutral Butterfly Switch: Buy 1.0x 10-Delta Strangle + ATM offset vs Sell ~1.65x 25-Delta Butterfly (matched by Black-Scholes Dollar Vomma)!
Can BF_10d ever be TOO LOW relative to BF_25d without creating butterfly arbitrage?
No! If BF_10d / BF_25d drops below ~1.6x–1.9x (for example if dealers dump 10d options heavily while 25d stays bid), the smile flattens or hooks downward between 25d and 10d, violating Durrleman’s g(k) ≥ 0 condition and creating riskless long-call butterfly arbitrages!
Publication record
- Published
- November 13, 2026
- Updated
- November 14, 2026
- Author
- Dr. Alistair Finch, CQF, FRM
- Review
- Review not recorded
- Automated fact check
- Passed in the stored pipeline record
- Source URLs
- 3 recorded
AI assistance recorded: anthropic/claude-opus-4.6. This field does not establish human review or source verification.
Academic & Institutional Attribution
Cite This Research & Embed Live Data Card
Standard academic & institutional research paper citation format.
Dr. Alistair Finch, CQF, FRM. (2026, November 14). FX 10-Delta Wing Butterflies vs 25-Delta Flies: Jump Kurtosis Pricing. VolSurface Desk. https://volsurfacedesk.com/desk-notes/fx-10-delta-wing-butterflies-em-jump-kurtosis-pricingRelated FX Risk Reversal Strangle Surfaces & Institutional Briefings
Explore FX Risk Reversal Strangle Surfaces Hub (20) →FX Risk Reversal Strangle Surfaces
FX Volatility Surfaces: 25-Delta Risk Reversals, 10d Butterflies & Event Vol GuideFX Risk Reversal Strangle Surfaces
Overnight FX Central-Bank Event Variance Weights (FOMC, ECB, BoJ)FX Risk Reversal Strangle Surfaces
Sticky-Strike vs Sticky-Delta FX Smiles: Shadow-Delta Hedging MathFX Risk Reversal Strangle Surfaces
Vanna-Volga & First-Exit Attenuation on FX Double-No-Touch (DNT) BarriersFX Risk Reversal Strangle Surfaces
FX Reverse Knock-Out (RKO) Barriers: Discontinuous Gamma, Vanna & OverhedgesFX Risk Reversal Strangle Surfaces
New York 10:00 AM Cut vs Tokyo 3:00 PM Expiry: Intraday FX Theta ClocksFX Risk Reversal Strangle Surfaces
CME Listed FX Options (6E, 6J) vs Interbank OTC Smile Basis ArbitrageFX Risk Reversal Strangle Surfaces
FX Cross-Currency Volatility Triangles & Implied Correlation ArbitrageIndex Dispersion Correlation Desk
Optimal 25-Stock Proxy Baskets vs Full 500-Stock S&P 500 DispersionIndex Dispersion Correlation Desk
Execution Microstructure Drag: OPRA Bid-Ask Spreads & Delta-Hedging SlippageIndex Dispersion Correlation Desk
Implied Correlation Skew: Why 90% Put Correlation Beats 110% Calls by 25+ PtsIndex Dispersion Correlation Desk
OTC Clean Correlation Swaps vs Option-Strip "Dirty" Dispersion Mechanics
VolSurface Desk Data, Benchmarks & Contributor Records
CC BY 4.0 Open Data
Open Institutional Datasets (CSV / JSON) →
Download desk-compiled quantitative series & schemas.
2026 Reference Matrix
2026 Institutional Benchmarks & Thresholds →
Statutory capital, clearing, margin & rate conventions.
Editorial Records
Authors & Review Records →
View named contributors where those records are available.
Complete Index
Master Research & Dossier Archive →
Browse all published briefings by topic pillar & date.