
Index Dispersion Correlation Desk
Vega-Neutral vs Theta-Neutral vs Variance-Neutral Dispersion Leg Sizing
Why does a Vega-neutral dispersion book bleed catastrophic short Gamma during a crash while a Theta-neutral dispersion book rallies on parallel volatility spikes? Master the three institutional dispersion leg-sizing equations.
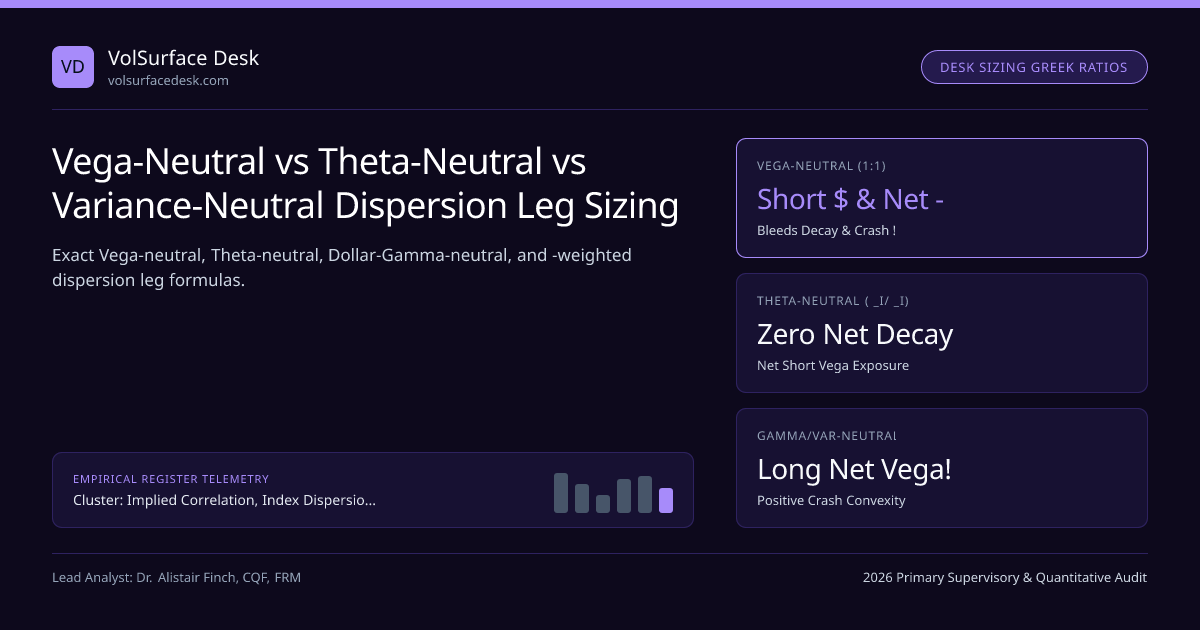
Ask ten junior derivatives traders how to size a long S&P 500 Index Dispersion basket when weighted single-stock implied volatility is σ_S = 28.0% and SPX index implied volatility is σ_I = 14.0%, and nine will instinctively answer: "Buy $100,000 of single-stock Vega and sell $100,000 of SPX Vega." On a real institutional volatility desk, blind 1:1 Vega-neutral dispersion is a classic rookie trap: it simultaneously bleeds negative net Theta every quiet day and sits short massive net Dollar Gamma in a market crash!
Within our Implied Correlation, Index Dispersion Baskets & Earnings Vol Crush silo and the Dispersion Desk Manual, mastering the exact Black-Scholes scaling laws connecting Vega, Dollar Gamma ($Γ), Dollar Theta ($Θ), and Variance Notional is the single most consequential portfolio-construction decision on a dispersion desk.
The Fundamental Greek Scaling Paradox When σStock = 2 × σIndex#
For any zero-interest-rate ATM option or OTC Variance Swap with time to expiry T (in years), spot price S, and implied volatility σ, Black-Scholes Vega (∂V/∂σ), Dollar Gamma ($Γ = S2 · ∂2V/∂S2), and annualized Dollar Theta ($Θ = ∂V/∂t = −1⁄2 · σ2 · $Γ) obey two exact identities:
- Look closely at σ in the denominator of $Γ versus the numerator of |$Θ| when σS = 28% (0.28) and σI = 14% (0.14) at T = 0.25 yr (91 days):
- 1) 1:1 Vega-Neutral (+$100k Stock Vega vs −$100k SPX Vega): Net Vega = $0. Stock $Γ = $100k/(0.28×0.25) = +$1.429M vs SPX $Γ = −$100k/(0.14×0.25) = −$2.857M ⇒ Net SHORT −$1.429M $Γ! Daily Stock Θ = −$2,192/day vs SPX Θ = +$1,096/day ⇒ Net BLEED −$1,096/day!
- 2) Theta-Neutral (+$50k Stock Vega vs −$100k SPX Vega, ratio VS/VI = σI/σS = 0.50): Daily Θ = −$1,096 + $1,096 = $0/day! Net Vega = −$50k (short parallel vol!), Net $Γ = +$0.714M − $2.857M = −$2.143M!
- 3) Dollar-Gamma / Variance-Neutral (+$100k Stock Vega vs −$50k SPX Vega, ratio VI/VS = σI/σS = √ρ_imp = 0.50): Stock $Γ = +$1.429M vs SPX $Γ = −$1.429M ⇒ Net $Γ = $0 in a ρ = 1.00 parallel crash! Net Vega = +$50k LONG Vega cushion, financed by −$1,644/day net Theta!
Verify every single number in that proof instantaneously by plugging a 91-day 14%-vol SPX straddle and a 28%-vol single-stock straddle into our Option Greeks & GEX Calculator and Black-Scholes Calculator.
Four Institutional Dispersion Leg-Sizing Architectures Compared#
Why "1:1 Vega Neutral" Is Not Even Neutral to Real-World Volatility Shocks!#
Notice the subtle trap hidden inside 1:1 Vega neutrality: it only breaks even on implied volatility marks if SPX implied volatility and single-stock implied volatilities rise by the exact same absolute number of vol points (e.g., SPX 14% → 19% [+5v] and AAPL/MSFT 28% → 33% [+5v]). What actually happens when a geopolitical shock hits?
- If pairwise correlation ρ stays constant at 0.25 while every stock's volatility jumps proportionally by +25% (28% → 35%, +7.0 vol points), SPX volatility jumps by +25% from 14% → 17.5% (+3.5 vol points)—a 1:1 Vega book wins +$350k!
- Conversely, in a pure macro correlation panic (see Macro Liquidation Correlation-Spike Drawdowns), single-stock vol rises from 28% → 36% (+8.0v) while ρ jumps from 0.25 → 0.64, driving SPX vol from 14% → 28.8% (+14.8v)! On a 1:1 Vega book, SPX loses −$1.48M while stocks gain +$0.80M = −$680k Vega loss PLUS −$420k short-Gamma loss!
Complete Side-by-Side Comparison Matrix (Per $100k Long Basket Vega, σS = 28%, σI = 14%, T = 0.25y)#
| Sizing Scheme | Basket Vega (Long) | SPX Vega (Short) | Net Vega ($) | Net Dollar Gamma ($Γ) | Daily Net Theta ($/day) | Ideal Deployment Regime |
|---|---|---|---|---|---|---|
| Theta-Neutral | +$100,000 | −$200,000 | −$100,000 | −$4,286,000 | $0 / day | Post-panic high-VIX / high-COR1M mean reversion (Cboe COR1M > 45) |
| 1:1 Vega-Neutral | +$100,000 | −$100,000 | $0 | −$1,429,000 | −$1,096 / day | Moderate COR1M (26–35) with OTM Cboe VIX call-spread wing |
| Empirical Vol-Beta (√ρ ≈ 0.70) | +$100,000 | −$70,000 | +$30,000 | −$571,000 | −$1,425 / day | Institutional core multi-pod dispersion book under FINRA 4210 PM |
| Dollar-Gamma / Variance-Neutral | +$100,000 | −$50,000 | +$50,000 | $0 | −$1,644 / day | Low-VIX / peak earnings jump extraction (Pre-Earnings σ_earn) |
Stress-Test P&L: -6% SPX Shock (COR1M Jumps 22 → 58) Per $100k Basket Vega#
Institutional dispersion PMs dynamically rotate their SPX-to-basket Vega ratio along the Cboe COR3M cycle: running Dollar-Gamma-neutral (0.50x SPX Vega) when COR3M sits below 20 and VIX sits at 13, then ratcheting short SPX Vega toward 0.85x–1.15x only after a macro shock lifts COR3M above 42!
Frequently asked questions
Why are Dollar Gamma and Dollar Theta NOT both neutral at the same leg ratio when σ_stock ≠ σ_SPX?
Look at the two exact Black-Scholes identities for ATM options: Dollar Gamma ($Γ = S2·Γ) equals Vega / (σ·T), whereas daily Dollar Theta (|$Θ|) equals 1⁄2·σ2·S2·Γ = 1⁄2·(σ/T)·Vega! Thus per $1 of Vega, higher-volatility single stocks have HALF the Dollar Gamma (1/28% vs 1/14%) yet TWICE the Dollar Theta decay (28% vs 14%)!
What happens to a 1:1 Vega-neutral long dispersion book if S&P 500 gaps down 5% overnight?
At 1:1 Vega neutrality ($100k long stock Vega at 28% vol vs $100k short SPX Vega at 14% vol), your SPX short leg carries TWICE the Dollar Gamma ($Γ ∝ Vega/σ) of your long single-stock legs! When correlation spikes to 0.90 in a 5% market gap, your net short Dollar Gamma causes severe mark-to-market losses unless hedged.
How does Theta-neutral dispersion behave differently from Dollar-Gamma-neutral dispersion?
Theta-neutral sizing sets ∑ w_i·Vega_i·σ_i = Vega_I·σ_I (e.g., $50k stock Vega at 28% vs $100k short SPX Vega at 14%), leaving zero net daily time decay in calm markets—but net SHORT $50k Vega and 4:1 short Dollar Gamma! Variance-neutral (√ρ-scaled) sizing sets Vega_i / σ_i = Vega_I / σ_I ($200k stock Vega vs $100k short SPX Vega), neutralizing Dollar Gamma and making the book net LONG $100k Vega!
Which dispersion sizing scheme is most popular on institutional multi-strategy volatility pods?
Correlation-weighted (or √ρ Vega-weighted, Vega_I ≈ √ρ_imp · ∑ w_i Vega_i) sits right between pure Vega-neutral and Dollar-Gamma-neutral: if ρ_imp = 0.25 (√ρ = 0.50), selling $50k–$70k of SPX Vega against $100k of constituent Vega leaves the book long +$30k to +$50k net Vega, cushioning parallel VIX spikes while paying modest Theta for tail safety!
Publication record
- Published
- November 13, 2026
- Updated
- November 14, 2026
- Author
- Dr. Alistair Finch, CQF, FRM
- Review
- Review not recorded
- Automated fact check
- Passed in the stored pipeline record
- Source URLs
- 3 recorded
AI assistance recorded: anthropic/claude-opus-4.6. This field does not establish human review or source verification.
Academic & Institutional Attribution
Cite This Research & Embed Live Data Card
Standard academic & institutional research paper citation format.
Dr. Alistair Finch, CQF, FRM. (2026, November 14). Vega-Neutral vs Theta-Neutral vs Variance-Neutral Dispersion Leg Sizing. VolSurface Desk. https://volsurfacedesk.com/desk-notes/vega-neutral-vs-theta-neutral-variance-dispersion-sizingRelated Index Dispersion Correlation Desk & Institutional Briefings
Explore Index Dispersion Correlation Desk Hub (20) →Index Dispersion Correlation Desk
Implied Correlation, Index Dispersion Baskets & Earnings Vol Crush: Desk ManualIndex Dispersion Correlation Desk
Mega-Cap Concentration (Top-7 SPX Weights) & COR1M Compression BiasIndex Dispersion Correlation Desk
Pre-Earnings Implied Jump Extraction (σ_earn): Stripping Event VarianceIndex Dispersion Correlation Desk
Correlation-Spike Tail Risk: Why Dispersion Books Bleed in Macro PanicsIndex Dispersion Correlation Desk
Optimal 25-Stock Proxy Baskets vs Full 500-Stock S&P 500 DispersionIndex Dispersion Correlation Desk
Execution Microstructure Drag: OPRA Bid-Ask Spreads & Delta-Hedging SlippageIndex Dispersion Correlation Desk
Implied Correlation Skew: Why 90% Put Correlation Beats 110% Calls by 25+ PtsIndex Dispersion Correlation Desk
OTC Clean Correlation Swaps vs Option-Strip "Dirty" Dispersion MechanicsMarket Insights
Nikkei 225 (Derivatives) Price (NI225/USD) Today | Live Price, Market Cap & Chart - BinanceMarket Insights
BC-Nikkei 225 Futures - Yahoo FinanceMarket Insights
Market positioning risks mount as macro hedge funds face worst stretch in yearsMarket Insights
Top Wall Street analysts are bullish on these 3 stocks for strong long-term growth potential
VolSurface Desk Data, Benchmarks & Contributor Records
CC BY 4.0 Open Data
Open Institutional Datasets (CSV / JSON) →
Download desk-compiled quantitative series & schemas.
2026 Reference Matrix
2026 Institutional Benchmarks & Thresholds →
Statutory capital, clearing, margin & rate conventions.
Editorial Records
Authors & Review Records →
View named contributors where those records are available.
Complete Index
Master Research & Dossier Archive →
Browse all published briefings by topic pillar & date.