
Dealer Gamma Vanna Charm Flows
Vanna (∂Δ/∂σ) Mechanical Equity Rallies After CPI & FOMC Volatility Crushes
Understand why S&P 500 futures surge after in-line or even hawkish CPI and FOMC prints: mathematical derivation of dealer OTM put Vanna (∂Δ/∂σ) unwinds during volatility crushes.
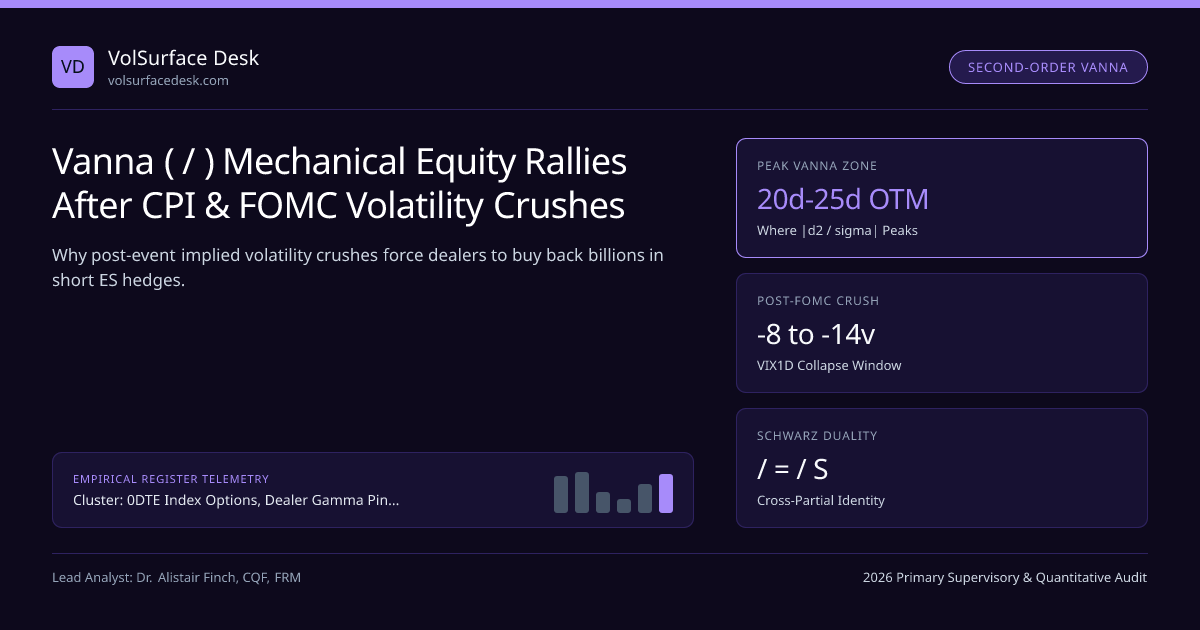
Few market phenomena frustrate fundamental macro traders more than the post-event Vanna squeeze: Consumer Price Index (CPI) inflation prints 0.1% hotter than consensus at 08:30 ET, or the Federal Reserve delivers a hawkish dot-plot at 14:00 ET, yet after a brief 10-minute dip S&P 500 futures rip +95 points higher into the close. Within the 0DTE Index Options, Dealer Gamma Pinning, Vanna & Charm Rehedging framework and our 0DTE Dealer Gamma, Vanna & Charm Flows Guide, this rally is neither irrational exuberance nor short-covering guesswork—it is the deterministic partial derivative Vanna (∂Δ/∂σ) executing across dealer balance sheets.
Exact Analytical Formula and Sign Geometry of Black-Scholes Vanna#
By Clairaut's theorem on mixed partial derivatives of the Black-Scholes-Merton option value V(S, t, σ), Vanna measures two identical economic sensitivities simultaneously—the sensitivity of option Delta to implied volatility (∂Δ/∂σ), and the sensitivity of option Vega to underlying spot (∂Vega/∂S):
- OTM Put Geometry (K < F => d2 > 0): Put Δ is negative (−N(−d1)). Raising σ increases put Δ magnitude (more negative); CRUSHING σ (Δσ < 0) shrinks put Δ toward 0!
- Dealer Short-Put Inventory: Dealers short Np OTM puts hold −Np · |Δput| short CME ES contracts. When Δσ < 0, |Δput| drops, forcing dealers to BUY ES futures: ΔHES = −Vannadealer · Δσ > 0!
- Worked Post-FOMC Unwind (SPX = 5,850, Dealers Short 180,000 Contracts of 14-DTE 5,700 Puts, T = 0.0384 yr):
- Pre-FOMC σ = 19.5% => Δput = −0.248 (Dealers short −8,928 ES). Post-FOMC σ crushes −3.8 pts to 15.7% => Δput shrinks to −0.171 (Dealers need only −6,156 ES) => Mechanical BUY of +2,772 ES ($810.8M) on ONE strike!
Traders inspect exact Vanna values across strikes in our Black-Scholes Option Calculator and aggregate multi-strike exposure in the Option Greeks & GEX Calculator.
Pre-Event Hedge Accumulation to Post-Print Vanna Rally#
The Self-Reinforcing Spot-Up / Vol-Down Equity Feedback Loop#
Notice what happens after the initial post-FOMC volatility crush triggers +$2.5B of dealer ES Vanna buying (Vanna & Charm Second-Order Hedging):
- Mechanical ES buying lifts S&P 500 spot by +35 points.
- Because equity index volatility surfaces exhibit strongly negative spot-vol correlation (ρ ≈ −0.75 on Cboe VIX and VIX1D), the +35 point spot rally pushes implied volatility down by another −0.8 vol points along the skew curve!
- That secondary −0.8 vol drop triggers yet another round of positive Vanna ES buying, while simultaneously shifting spot higher toward positive Net Dealer GEX strikes and accelerating afternoon Charm (∂Δ/∂t) put decay!
Asymmetric Vanna Across Put Skew vs Call Overwriting Books#
Why doesn't call-wing Vanna cancel out put-wing Vanna during an event crush? Because institutional index positioning is structurally skewed:
| Option Wing & Typical Inventory | Dealer Position Sign | Effect of −3.5 Vol Post-Event Crush on Option Delta | Resulting Dealer CME ES Futures Trade |
|---|---|---|---|
| 15d–30d Downside SPX Puts | Net Short Puts (sold to macro hedgers) | Put Δ shrinks from −0.25 toward −0.17 | BUY ES Futures (cover excess short hedges) |
| 15d–30d Upside SPX Calls | Net Long Calls (bought from collar/ETF overwriters) | Call Δ shrinks from +0.25 toward +0.18 | BUY ES Futures (replace lost positive call delta!) |
| Retail Speculative 0DTE Calls | Net Short 0DTE Calls (intraday lotto buyers) | Call Δ shrinks toward 0.00 | SELL ES Futures (unwinds small intraday long hedge) |
| ATM Event Straddles | Mixed / Near Balanced | d2 ≈ 0 => Vanna ≈ 0 | Negligible Vanna; governed purely by Gamma & Charm |
Look closely at Row 2! Because institutional funds like the JPMorgan HEQT Collar and systematic covered-call ETFs sell upside 20d–30d calls to dealers, dealers are frequently net long upside calls AND net short downside puts on 7-to-60 DTE tenors! When implied volatility crushes across the board, both wings generate dealer ES buying—short puts lose negative delta (buy ES) and long calls lose positive delta (also buy ES to stay delta-neutral)!
Post-CPI / FOMC Dealer Vanna ES Flow Across Event Outcomes#
Only when a macro shock exceeds ~1.8 to 2.2 times the pre-event implied move calculated in our 0DTE Expected Move Calculator does implied volatility expand post-print—flipping Vanna negative and compounding Zomma gamma expansion into a genuine liquidation session across CFTC-regulated futures venues like CME.
Frequently asked questions
Why is Vanna near zero for at-the-money options and maximal for 20-to-25 delta wings?
An at-the-money forward option already has approximately 0.50 delta regardless of whether implied volatility is 12% or 35% (specifically d2 is near zero). By contrast, a 5% out-of-the-money put jumps from -0.11 delta at 12% IV to -0.31 delta at 28% IV, creating huge sensitivity ∂Δ/∂σ.
Why do equities frequently rally after a slightly hot CPI or hawkish FOMC press conference?
Macro hedge funds over-hedge tail outcomes using OTM puts pushing VIX1D above 24-30 pre-event. As long as the actual print avoids a catastrophic tail scenario, VIX1D collapses 8-12 vol points and 7-30 DTE IV drops 2-4 points, unleashing mechanical dealer Vanna ES buying that overwhelms discretionary macro selling.
Does customer call buying create positive or negative dealer Vanna during a vol crush?
If customers buy 25-delta OTM calls and dealers are short those calls, dealers carry long ES hedges. An implied volatility crush shrinks OTM call deltas toward zero, causing dealers to SELL ES futures—partially offsetting downside-put Vanna unless put skew positioning dominates.
How does Vanna link to risk-reversal volatility skew pricing on the surface?
Because ∂Δ/∂σ = ∂Vega/∂S by Schwarz symmetry, a portfolio carrying Vanna also changes its net Vega whenever spot moves. Persistent institutional demand for downside OTM puts embeds structural skew that amplifies Vanna notional on the put wing relative to the call wing.
Publication record
- Published
- November 14, 2026
- Updated
- November 14, 2026
- Author
- Dr. Alistair Finch, CQF, FRM
- Review
- Review not recorded
- Automated fact check
- Passed in the stored pipeline record
- Source URLs
- 3 recorded
AI assistance recorded: anthropic/claude-opus-4.6. This field does not establish human review or source verification.
Academic & Institutional Attribution
Cite This Research & Embed Live Data Card
Standard academic & institutional research paper citation format.
Dr. Alistair Finch, CQF, FRM. (2026, November 14). Vanna (∂Δ/∂σ) Mechanical Equity Rallies After CPI & FOMC Volatility Crushes. VolSurface Desk. https://volsurfacedesk.com/desk-notes/vanna-ddelta-dvol-rally-fuel-cpi-fomc-vol-crushRelated Dealer Gamma Vanna Charm Flows & Institutional Briefings
Explore Dealer Gamma Vanna Charm Flows Hub (20) →Dealer Gamma Vanna Charm Flows
0DTE Index Options, Net Dealer Gamma (GEX), Vanna & Charm Rehedging Flows GuideDealer Gamma Vanna Charm Flows
Charm (∂Δ/∂t) Time-Bleed Mechanics: Intraday, Weekend & OPEX Equity DriftDealer Gamma Vanna Charm Flows
Vomma (Volga, ∂2V/∂σ2) Wing Convexity: Why Short 5-Delta Strangles Blow UpDealer Gamma Vanna Charm Flows
Speed (∂Γ/∂S) Third-Order Gamma Gradients & 0DTE Iron Condor Strike CliffsDealer Gamma Vanna Charm Flows
Zomma (∂Γ/∂σ) Mechanics: How Implied Volatility Shocks Mutate Dealer GammaDealer Gamma Vanna Charm Flows
Color (∂Γ/∂t) Gamma Decay vs Final-Hour 0DTE ATM Pin Risk Before 16:00 ETDealer Gamma Vanna Charm Flows
Institutional Quarterly Equity Collar Rolls (JPM HEQT) & Strike PinningDealer Gamma Vanna Charm Flows
Nasdaq-100 (NDX & QQQ) vs S&P 500 (SPX) 0DTE Gamma Pinning & Vol SpreadsVix Futures Variance Swap Convexity
OTC S&P 500 Variance Swaps: Vega-to-Variance Notional & Convexity MathVix Futures Variance Swap Convexity
Capped (2.5× Strike) vs Uncapped Variance Swaps: Left-Tail Gap RiskVix Futures Variance Swap Convexity
Corridor Variance & Conditional Down-Variance Swaps: Targeted Crash HedgesVix Futures Variance Swap Convexity
Cboe VVIX Vol-of-Vol & Jensen’s Inequality: The VIX Futures Convexity Wedge
VolSurface Desk Data, Benchmarks & Contributor Records
CC BY 4.0 Open Data
Open Institutional Datasets (CSV / JSON) →
Download desk-compiled quantitative series & schemas.
2026 Reference Matrix
2026 Institutional Benchmarks & Thresholds →
Statutory capital, clearing, margin & rate conventions.
Editorial Records
Authors & Review Records →
View named contributors where those records are available.
Complete Index
Master Research & Dossier Archive →
Browse all published briefings by topic pillar & date.