
Dealer Gamma Vanna Charm Flows
Nasdaq-100 (NDX & QQQ) vs S&P 500 (SPX) 0DTE Gamma Pinning & Vol Spreads
Analyze structural differences between Nasdaq-100 (NDX/QQQ) and S&P 500 (SPX) 0DTE options: +3.5 to +5.2 VXN-VIX implied volatility spreads, $2M+ NDX contract notional, and CME NQ liquidity gaps.
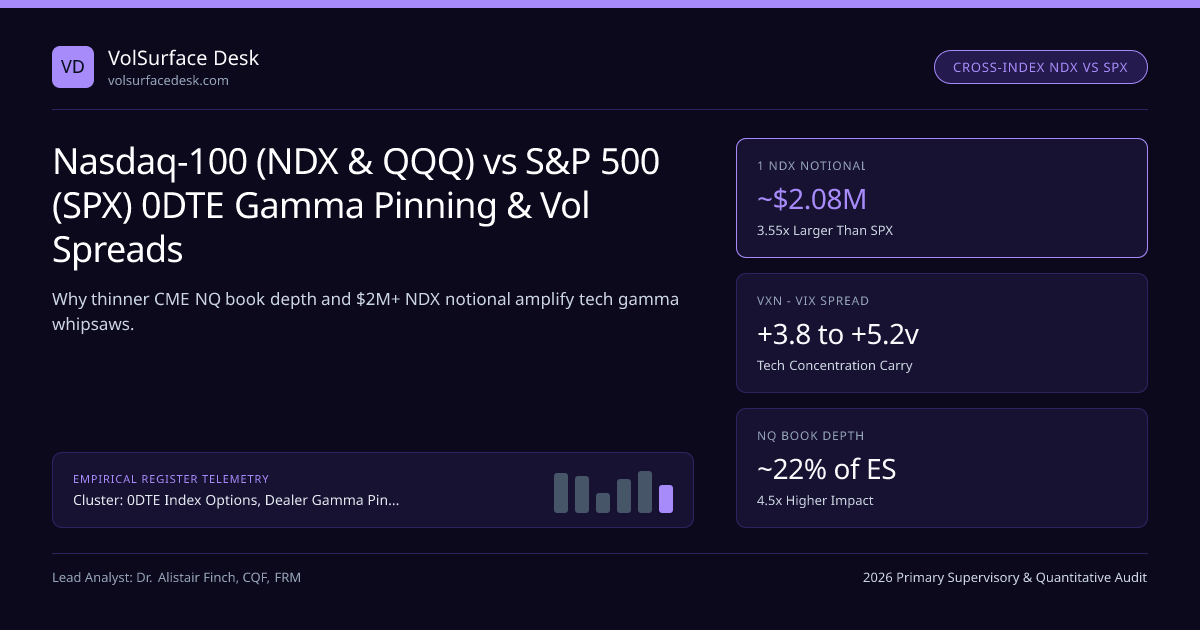
Systematic volatility desks never treat U.S. equity index 0DTE flows as a single monolith. Comparing the S&P 500 (SPX / SPY) complex against the Nasdaq-100 (NDX / QQQ) complex (NDX vs SPX Implied Volatility & Tech Gamma Benchmark) uncovers profound structural divergences in contract granularity, cash-versus-physical settlement splits, futures limit-order-book depth, and constituent correlation.
Within the 0DTE Index Options, Dealer Gamma Pinning, Vanna & Charm Rehedging silo and our 0DTE Dealer Gamma, Vanna & Charm Flows Guide, exploiting the NDX-minus-SPX 0DTE volatility spread is a core intraday relative-value strategy across institutional desks.
Contract Scaling, Order-Book Elasticity, and Cross-Index Gamma Ratios#
Why does a −$1.5B negative gamma state in NDX/QQQ generate violent 1.8% intraday whipsaws whereas −$1.5B in SPX barely registers? The answer lies in comparing notional per contract and futures order-book Kyle impact λ across CME E-mini S&P 500 (ES) versus E-mini Nasdaq-100 (NQ) futures:
Quantitative Pricing Model: Nasdaq-100 (NDX/QQQ) vs SPX 0DTE Gamma & Vol Spreads#
- Contract Notional Ratio: At NDX = 20,800 ($100 mult = $2,080,000) vs SPX = 5,850 ($100 mult = $585,000), 1 NDX option = 3.556× SPX notional!
- Beta-Adjusted 0DTE Straddle Switch: Long 1 NDX ATM Straddle vs Short (3.556 × β_NDX/SPX) ≈ 4.45 SPX ATM Straddles equates dollar gamma exposure!
- Worked Intraday RV Trade (NDX = 20,800 @ σ0DTE = 16.2%, SPX = 5,850 @ σ0DTE = 13.5%, Implied Ratio = 1.200x vs 20-Day Realized Ratio = 1.34x):
- Buying 10 NDX ATM 0DTE Straddles ($142.80 = $142.8k) vs Selling 40 SPX ATM 0DTE Straddles ($26.10 = $104.4k) captures +1.85 vol pts of cheap tech convexity!
Traders price both legs side-by-side in our 0DTE Expected Move Calculator and equalize dollar gamma across NDX, QQQ, and SPX using the Option Greeks & GEX Calculator.
Microstructure Divergence: SPX/ES vs NDX/QQQ/NQ 0DTE Ecosystems#
Structural Comparison: S&P 500 vs Nasdaq-100 0DTE Volatility Complexes#
| Microstructure Dimension | S&P 500 Complex (SPX / SPY / ES) | Nasdaq-100 Complex (NDX / QQQ / NQ) | Relative-Value Desk Takeaway |
|---|---|---|---|
| Primary Listed Venue | Exclusive Cboe SPX cash-settled | Nasdaq PHLX/ISE/GEMX NDX + multi-exchange QQQ | QQQ multi-exchange routing fragments MM inventory |
| Cash vs Physical Split | Dominated by cash-settled SPX (no AH pin) | Heavy physical-delivery QQQ (Color pin risk) | Expect sharper 15:35–15:55 ET QQQ flattening squeezes |
| Top-7 Mega-Cap Weight | ~31% of S&P 500 capitalization | ~44% of Nasdaq-100 capitalization | Single NVDA/AAPL intraday headline moves NDX 1.4x SPX |
| Futures Hedge Liquidity | Deep CME ES (~$12M–$25M top-of-book) | Thin CME NQ (~$2.5M–$5M top-of-book) | Short GEX in QQQ/NDX triggers 2x faster air-pockets |
0DTE NDX-Minus-SPX Straddle Switch Performance by Spread Percentile#
Because both SPX and NDX clear at the Options Clearing Corporation under SEC supervision, institutional accounts utilizing FINRA Rule 4210 Portfolio Margin receive 85% to 90% cross-index basket offset credit between opposing NDX and SPX legs—making gamma-neutral NDX/SPX switches extraordinarily capital-efficient!
Frequently asked questions
Why do retail 0DTE traders dominate QQQ ETF options rather than full-sized NDX index options?
At NDX = 20,800, one 10-point NDX vertical spread risks $1,000 and an ATM straddle costs ~$14,500 ($145.00 × 100), whereas QQQ (~$505) scales notional down by 1/40th. Consequently, QQQ captures massive physical-delivery 0DTE flow while institutions use cash-settled NDX and micro XND/NDXP.
Why does Nasdaq-100 exhibit sharper intraday air-pockets than S&P 500 under negative GEX?
Recall the feedback volatility formula σ_real = σ_fund / (1 − λ·|Γ_dealer|). Because CME NQ futures carry far thinner resting limit-order depth (higher λ) than CME ES, even half as much negative dealer dollar gamma in NDX/QQQ triggers larger percentage point cascades!
What is the typical realized beta and implied volatility ratio between NDX and SPX?
In normal non-earnings sessions, NDX exhibits a 1.22x to 1.32x realized volatility ratio (and ~1.25 intraday beta) relative to SPX. When the implied VXN-to-VIX ratio drops below 1.18x ahead of mega-cap AI/semiconductor catalysts, owning NDX gamma against short SPX gamma offers positive convexity.
How does physical QQQ 16:00 ET pin risk spill over into CME NQ futures?
Because QQQ options deliver physical ETF shares subject to OCC 17:30 ET contrary exercise cutoffs, QQQ market makers aggressively flatten near-the-money short gamma between 15:35 ET and 15:55 ET using CME NQ futures, creating independent late-day tech squeezes.
Publication record
- Published
- November 13, 2026
- Updated
- November 14, 2026
- Author
- Dr. Alistair Finch, CQF, FRM
- Review
- Review not recorded
- Automated fact check
- Passed in the stored pipeline record
- Source URLs
- 3 recorded
AI assistance recorded: anthropic/claude-opus-4.6. This field does not establish human review or source verification.
Academic & Institutional Attribution
Cite This Research & Embed Live Data Card
Standard academic & institutional research paper citation format.
Dr. Alistair Finch, CQF, FRM. (2026, November 14). Nasdaq-100 (NDX & QQQ) vs S&P 500 (SPX) 0DTE Gamma Pinning & Vol Spreads. VolSurface Desk. https://volsurfacedesk.com/desk-notes/nasdaq-100-ndx-vs-spx-0dte-gamma-liquidity-spreadRelated Dealer Gamma Vanna Charm Flows & Institutional Briefings
Explore Dealer Gamma Vanna Charm Flows Hub (20) →Dealer Gamma Vanna Charm Flows
0DTE Index Options, Net Dealer Gamma (GEX), Vanna & Charm Rehedging Flows GuideDealer Gamma Vanna Charm Flows
OCC STANS 20-Minute Intraday Risk Snapshots & 0DTE Margin Add-OnsDealer Gamma Vanna Charm Flows
FINRA Rule 4210 TIMS Portfolio Margin vs Reg T Haircuts for Index BooksDealer Gamma Vanna Charm Flows
Signed Dealer Gamma Reconstruction: Cboe Open-Close Data vs Naive OI GEXDealer Gamma Vanna Charm Flows
Monthly Third-Friday AM-Settled SPX OPEX & 09:30 ET SOQ Gamma UnwindsDealer Gamma Vanna Charm Flows
Overnight CME Globex ES & Cboe GTH Gamma Hedging Gaps Into 09:30 ET OpenDealer Gamma Vanna Charm Flows
Systematic Put-Write & Call-Overwrite ETFs (PUTW, XYLD, JEPI) Gamma SupplyDealer Gamma Vanna Charm Flows
Whalley-Wilmott Discrete Gamma Hedging Bandwidths Under ES Transaction CostsVix Futures Variance Swap Convexity
Eurex VSTOXX (FVS) vs Cboe VIX (VX) Cross-Atlantic Volatility SpreadsVix Futures Variance Swap Convexity
Cross-Asset Spillover: CME SOFR Bachelier Swaption Vol & MOVE Into VIXVix Futures Variance Swap Convexity
Volatility Swaps vs Variance Swaps: Exact Vol-of-Vol Convexity PricingVix Futures Variance Swap Convexity
Leveraged & Inverse VIX ETPs (UVIX, SVIX): 16:00 ET TAS Rebalancing Flows
VolSurface Desk Data, Benchmarks & Contributor Records
CC BY 4.0 Open Data
Open Institutional Datasets (CSV / JSON) →
Download desk-compiled quantitative series & schemas.
2026 Reference Matrix
2026 Institutional Benchmarks & Thresholds →
Statutory capital, clearing, margin & rate conventions.
Editorial Records
Authors & Review Records →
View named contributors where those records are available.
Complete Index
Master Research & Dossier Archive →
Browse all published briefings by topic pillar & date.