
Vix Futures Variance Swap Convexity
OTC S&P 500 Variance Swaps: Vega-to-Variance Notional & Convexity Math
Decode institutional ISDA variance swap term sheets: annualized 252-day realized log-return formulas, exact conversion between Vega Notional and Variance Notional, and why long variance doubles vega exposure in a crash.
Suppose a macro hedge fund anticipates a violent S&P 500 volatility regime shift over the next six months and buys a 6-month ATM SPX 5,850 straddle to delta-hedge daily. Two months in, S&P 500 drops −16% to 4,914 and then whipsaws ±3% a day at 42% realized volatility—yet the fund's original 5,850 straddle now sits 936 points away from spot with virtually zero remaining Gamma or Vega, missing the entire volatility explosion!
Within the VIX Term Structure, Variance Swaps, Vol-of-Vol VVIX & Tail Hedging silo and our VIX, Variance Swaps & Tail Hedging Guide, institutional desks solve this strike path-dependency via Over-the-Counter (OTC) S&P 500 Variance Swaps (OTC SPX Variance Swaps Benchmark), governed by ISDA Equity Derivatives Definitions and SEC / CFTC security-based/broad-index swap rules.
Exact ISDA Term-Sheet Payoff, Vega Conversion, and Mid-Life Valuation#
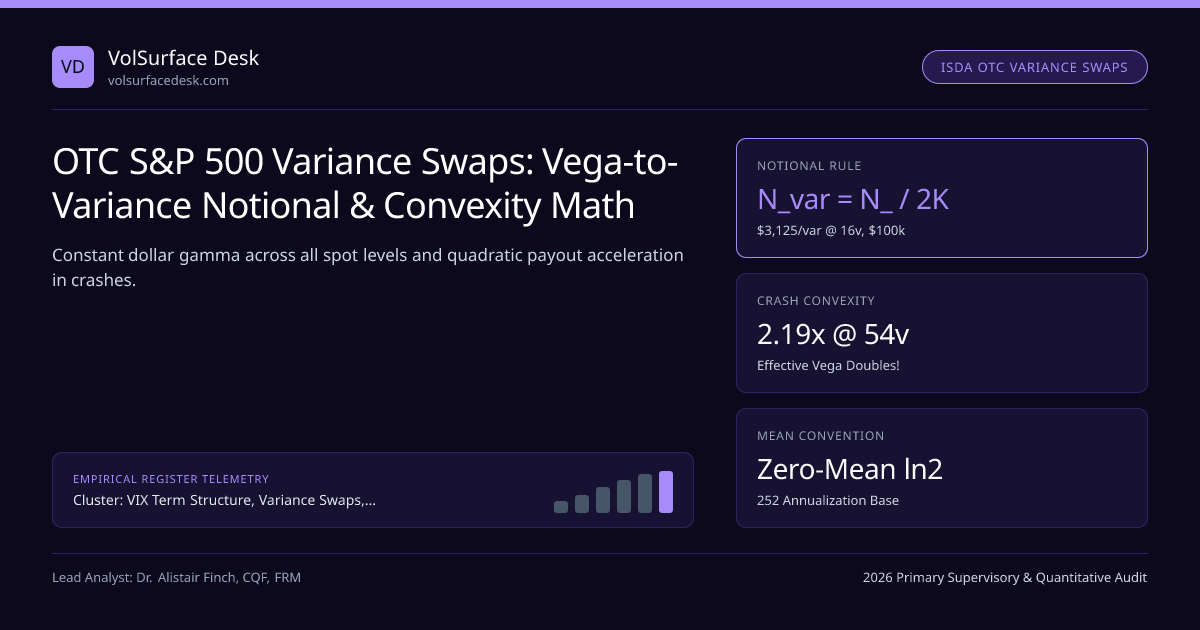
An OTC variance swap fixes Volatility Strike K_vol (in vol points, e.g., 16.00), expected observation count Nexp (e.g., 126 daily closes), and **Vega Notional Nvega ($ per vol point at strike). Converting to Variance Notional Nvar** ensures a small Δσ move around Kvol produces N_vega · Δσ P&L while large volatility moves accelerate quadratically:
Quantitative Pricing Model: OTC SPX Variance Swaps: Vega Notional & Convexity Guide#
- Quadratic Convexity Bonus: Payoff(T) = Nvega · (σreal − Kvol) + [ Nvega / (2 · Kvol) ] · (σreal − Kvol)2 ! Notice the second term is ALWAYS ≥ 0 for a LONG variance holder—even when σreal < K_vol!
- Mid-Life Mark-to-Market at Time t (m days elapsed): Kmtm2(t) = (m / Nexp)·σpast2 + ((Nexp − m) / Nexp)·Kimp_rem2(t).
- Worked $100,000 Vega-Notional SPX Variance Swap at Kvol = 16.00 (Nvar = $100,000 / 32 = $3,125/var pt):
- • Calm Bear Outcome (σ_real = 8.00, −8v below strike): Linear loss would be −$800,000; True Variance Loss = $3,125 × (64 − 256) = −$600,000 (+25% smaller loss!).
- • Crisis Outcome (σ_real = 48.00, +32v above strike): Linear gain would be +$3.20M; True Variance Gain = $3,125 × (2,304 − 256) = +$6,400,000 (2.00x linear gain!).
Traders compare individual option leg sensitivities against constant-dollar-gamma strips in our Option Greeks & GEX Calculator and Black-Scholes Option Calculator.
Bank Dealer Replication & Hedging of an OTC SPX Variance Swap#
Comparing Variance Swaps, Volatility Swaps, ATM Straddles, and VX Futures#
| Instrument ($100k Vega @ 16v) | P&L if Realized Vol = 8v (−8v) | P&L if Realized Vol = 48v (+32v) | Path Dependency & Operational Burden |
|---|---|---|---|
| Long Uncapped Variance Swap | −$600,000 (Concave cushion!) | +$6,400,000 (2.0x Convexity!) | Zero client rehedging! Settled in cash on daily SPX closes |
| Long OTC Volatility Swap | −$800,000 (Linear) | +$3,200,000 (Linear) | Cheaper strike Kvolswap < K_var by vol-of-vol wedge |
| Delta-Hedged 6M ATM Straddle | −$550k to −$780k | +$1.1M to +$3.8M (Path-dependent!) | Severe strike drift risk! Dies if SPX trends away early |
| Rolling CFE VX1 Futures | −$950k+ (Bleeds contango!) | +$1.8M to +$2.9M (Beta drag) | High path dependency + monthly roll slippage |
Dynamic Vega Scaling Inside a $100k Initial SPX Variance Swap (K = 16)#
Look at the fourth bar above ($400,000/pt instantaneous Vega at σ = 64): after 2008 and March 2020 wiped out hedge funds and structured-product desks that sold uncapped variance, dealers introduced 2.5× Capped Variance Swaps—the critical evolution we analyze next in Capped (2.5×) vs Uncapped Variance Swaps.
Frequently asked questions
Why do ISDA equity variance swap confirmations omit subtracting the mean daily return r̄?
Subtracting the sample mean r̄ makes daily variance path-dependent on the terminal drift and breaks exact additive time-aggregation across sub-periods! Setting zero-mean convention RV = (252 / N_obs) × 10,000 × Σ [ln(S_t / S_{t-1})]2 ensures clean daily mark-to-market additivity.
How do you convert $100,000 Vega Notional at a 16.00 volatility strike into Variance Notional?
Using N_var = N_vega / (2 × K_vol), $100,000 / (2 × 16.00) = $3,125 per variance point! Check near strike: if realized vol finishes at 17.00, 172 - 162 = 289 - 256 = 33 variance points; 33 × $3,125 = +$103,125 (~$100k for +1 vol point, plus $3,125 convexity!).
How is an open 6-month OTC variance swap marked to market mid-life after 2 months?
At time t with fraction α = N_elapsed / N_total already observed and (1 - α) remaining, fair mark-to-market variance equals V_mark2(t) = α · σ_realized_so_far2 + (1 - α) · K_implied_remaining2(t), discounted by e^(-r(T-t))!
Why do hedge funds prefer OTC SPX variance swaps over delta-hedging an ATM SPX straddle?
If SPX sells off -18% over three months, a single static 5,850 ATM straddle ends up 1,050 points ITM with near-zero Gamma and Vega right when realized volatility peaks at 45%! A variance swap automatically captures full 45-vol realized variance wherever spot travels with zero trader rehedging labor.
Publication record
- Published
- November 13, 2026
- Updated
- November 14, 2026
- Author
- Dr. Alistair Finch, CQF, FRM
- Review
- Review not recorded
- Automated fact check
- Passed in the stored pipeline record
- Source URLs
- 3 recorded
AI assistance recorded: anthropic/claude-opus-4.6. This field does not establish human review or source verification.
Academic & Institutional Attribution
Cite This Research & Embed Live Data Card
Standard academic & institutional research paper citation format.
Dr. Alistair Finch, CQF, FRM. (2026, November 14). OTC S&P 500 Variance Swaps: Vega-to-Variance Notional & Convexity Math. VolSurface Desk. https://volsurfacedesk.com/desk-notes/otc-spx-variance-swap-vega-notional-convexityRelated Vix Futures Variance Swap Convexity & Institutional Briefings
Explore Vix Futures Variance Swap Convexity Hub (20) →Vix Futures Variance Swap Convexity
VIX Term Structure, OTC Variance Swaps, VVIX Vol-of-Vol & Tail Hedging GuideVix Futures Variance Swap Convexity
Capped (2.5× Strike) vs Uncapped Variance Swaps: Left-Tail Gap RiskVix Futures Variance Swap Convexity
Corridor Variance & Conditional Down-Variance Swaps: Targeted Crash HedgesVix Futures Variance Swap Convexity
Cboe VVIX Vol-of-Vol & Jensen’s Inequality: The VIX Futures Convexity WedgeVix Futures Variance Swap Convexity
VIX 1×2 Call Ratios & Collars vs Direct SPX OTM Put Tail HedgesVix Futures Variance Swap Convexity
Ultra-Short VIX1D vs VIX9D, VIX & VIX3M Event Term-Structure KinksVix Futures Variance Swap Convexity
Wednesday Morning VIX SOQ Settlement (VRO) & SPX Strip Auction MechanicsVix Futures Variance Swap Convexity
Eurex VSTOXX (FVS) vs Cboe VIX (VX) Cross-Atlantic Volatility SpreadsFX Risk Reversal Strangle Surfaces
FX 10-Delta Wing Butterflies vs 25-Delta Flies: Jump Kurtosis PricingFX Risk Reversal Strangle Surfaces
Overnight FX Central-Bank Event Variance Weights (FOMC, ECB, BoJ)FX Risk Reversal Strangle Surfaces
Sticky-Strike vs Sticky-Delta FX Smiles: Shadow-Delta Hedging MathFX Risk Reversal Strangle Surfaces
Vanna-Volga & First-Exit Attenuation on FX Double-No-Touch (DNT) Barriers
VolSurface Desk Data, Benchmarks & Contributor Records
CC BY 4.0 Open Data
Open Institutional Datasets (CSV / JSON) →
Download desk-compiled quantitative series & schemas.
2026 Reference Matrix
2026 Institutional Benchmarks & Thresholds →
Statutory capital, clearing, margin & rate conventions.
Editorial Records
Authors & Review Records →
View named contributors where those records are available.
Complete Index
Master Research & Dossier Archive →
Browse all published briefings by topic pillar & date.