
Vix Futures Variance Swap Convexity
VIX 1×2 Call Ratios & Collars vs Direct SPX OTM Put Tail Hedges
Design institutional equity tail-hedging overlays: compare Cboe VIX call-spread collars and 1×2 call backspreads against direct 5-delta SPX puts across sudden liquidity crashes versus slow 2022-style bear grinds.
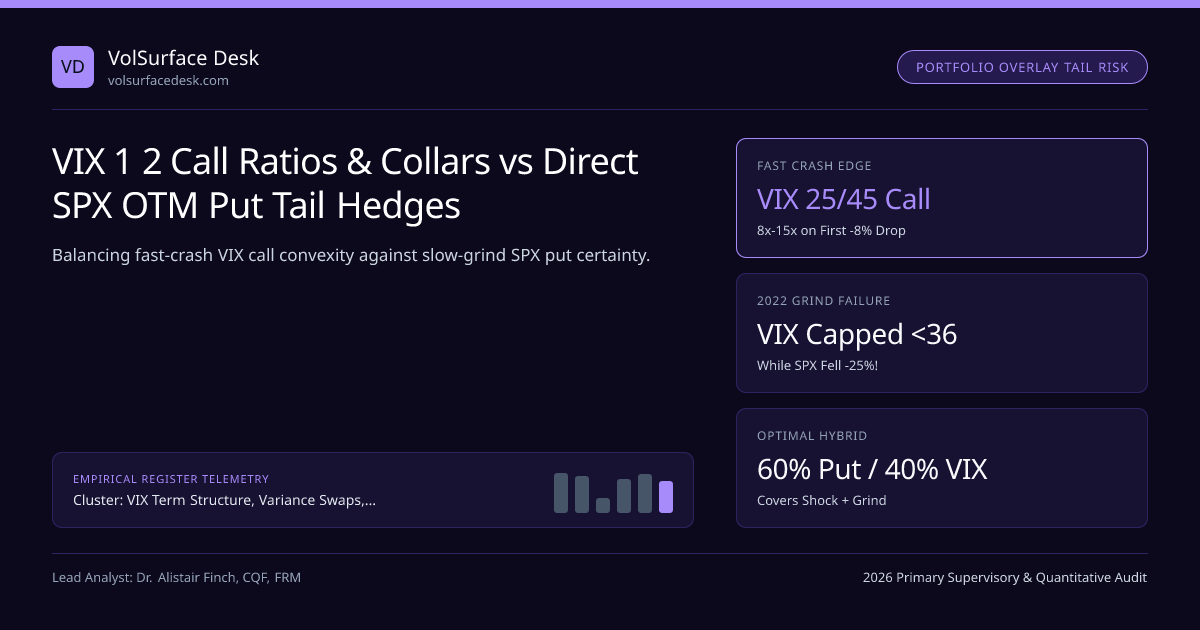
Every Chief Investment Officer managing multi-billion-dollar equity allocations faces the Tail-Hedge Trilemma: an ideal hedge should have (1) near-zero peacetime carry bleed, (2) explosive convex payoff in sudden crashes, and (3) zero basis risk in slow bear markets. No single derivative satisfies all three simultaneously! Comparing Cboe VIX Call-Spread Collars against Direct OTM SPX Puts (SPX 25-Delta Skew & Tail Pricing) reveals why institutional overlay desks combine both instruments in strict quantitative proportions.
Within the VIX Term Structure, Variance Swaps, Vol-of-Vol VVIX & Tail Hedging silo and our VIX, Variance Swaps & Tail Hedging Guide, let us benchmark exact payout-to-bleed mathematics across historical shock versus grind regimes.
Structuring Skew-Subsidized VIX Call-Spread Collars vs SPX Put Spreads#
Why does a naive 60-DTE 10%-OTM SPX put bleed so heavily, whereas a VX2 VIX Call-Spread Collar (Buy 24 Call / Sell 44 Call / Sell 14.5 Put when VX2 = 16.50) cuts annual carry cost by 60%? Look at the implied volatility skew differential monetized on each leg:
Quantitative Pricing Model: VIX Call Ratios & Collars vs SPX OTM Put Tail Hedges#
- Skew Subsidy #1 (Short Upper 44 Call): Selling 152% IV against buying 108% IV captures +44 vol points of positive VVIX right-wing skew!
- Skew Subsidy #2 (Short 14.5 Put Floor): Because Spot VIX rarely settles below 11.5, selling the 14.5 put risks at most $2.50–$3.00 in dead-calm bull markets—when the underlying S&P 500 equity portfolio is surging +4% to +7%!
- Worked $100M Equity Portfolio Overlay (VX2 = 16.50, 45-DTE, Budget = 60 bps/yr = $50k/mo):
- 24C ($1.42) − 44C ($0.39) − 14.5P ($0.48) = $0.55 Net Debit ($55 per contract)! Buying 900 collars costs $49,500; if sudden crash spikes VX2 to 44+, payoff = 900 × $20 × $100 = +$1,800,000 (+180 bps portfolio cushion = 36.4x outlay!).
Portfolio managers model exact Black-76 VIX collar legs and SPX put spreads side-by-side in our Black-Scholes Option Calculator.
Dual-Regime Institutional Equity Tail-Hedging Architecture#
Head-to-Head Regime Matrix: VIX Call Overlays vs Direct SPX Put Overlays#
| Crisis / Market Scenario | VIX 24/44 Call Spread / Collar | Direct 90-DTE SPX 90% OTM Put | Winner & Structural Reason |
|---|---|---|---|
| Sudden −8% Flash / Vol Shock (Aug 2024, Feb 2018) | Massive Winner (8x–16x); VX jumps to 32–40 immediately | Modest mark gain (+1.8x–2.5x); still 2% OTM | VIX Calls respond to velocity & VVIX |
| Deep Liquidity Crash −32% (Mar 2020, Oct 2008) | Capped Winner (20x–36x) if monetized before VIX mean-reverts! | Uncapped Intrinsic Winner (12x–22x) | Tie—monetize VIX calls early to buy equities! |
| Slow Orderly −25% Bear Grind (Full-Year 2022) | Complete Loser (0.0x!) VIX stayed 20–34 all year! | Reliable Winner (4x–6x); zero basis risk to SPX | SPX Puts eliminate rate-grind basis hazard |
| Calm +22% Bull Grind (2023 / 2024) | Minimal bleed (short 14.5P offsets equity gains) | Continuous 100% premium decay | VIX Collar preserves bull-market CAGR |
10-Year Portfolio Overlay Comparison ($100M S&P 500 Mandate)#
Both Cboe SPX and VIX index options qualify as Section 1256 contracts for U.S. institutional/taxable accounts, and dynamic monetization rules tied to Cboe SKEW > 150 further sharpen rebalance timing.
Frequently asked questions
Why did VIX tail hedges disappoint many institutional pension funds during the 2022 bear market?
In 2022, the S&P 500 declined -25% over 9 months via steady -0.8% daily macro repricing rather than sudden panic gaps. Dealers were already heavily hedged in SPX puts (muting short-gamma cascades), so VIX oscillated calmly between 22 and 34—expiring VIX 35–60 call spreads worthless month after month!
How does selling a VIX 25/45 call spread outperform buying a naked VIX 25 call on risk-adjusted terms?
Because VIX call implied volatility slopes sharply upward with strike (45 Call trades at ~155% IV vs 25 Call at ~105% IV!), selling the 45 Call monetizes rich VVIX right-wing skew, cutting net debit by 35%–45% while still capturing a $20,000 ($20.00) full spread payout!
What is the monetization trap with VIX call hedges compared to SPX put hedges?
Because VIX mean-reverts rapidly (half-life ~31 days), a VIX call hedge MUST be actively monetized (sold or rolled) during the panic peak while SPX is still falling! An SPX put hedge locks intrinsic dollar value as SPX stays low even after VIX subsides from 55 back to 28.
Why is a VIX 1x2 Call Backspread (Sell 1x 20C / Buy 2x 30C) dangerous versus a capped vertical?
Wait: Selling 1x 20C and Buying 2x 30C has a "valley of death" at VIX = 30 (-$10.00 max loss in mild -6% corrections!) while the reverse 1x2 (Buy 1x 22C / Sell 2x 35C) has UNCAPPED catastrophic short loss if VIX hits 75! Institutional overlays strictly cap short wings (1x2x1 butterflies or 1x1 collars).
Publication record
- Published
- November 13, 2026
- Updated
- November 14, 2026
- Author
- Dr. Alistair Finch, CQF, FRM
- Review
- Review not recorded
- Automated fact check
- Passed in the stored pipeline record
- Source URLs
- 3 recorded
AI assistance recorded: anthropic/claude-opus-4.6. This field does not establish human review or source verification.
Academic & Institutional Attribution
Cite This Research & Embed Live Data Card
Standard academic & institutional research paper citation format.
Dr. Alistair Finch, CQF, FRM. (2026, November 15). VIX 1×2 Call Ratios & Collars vs Direct SPX OTM Put Tail Hedges. VolSurface Desk. https://volsurfacedesk.com/desk-notes/vix-call-spread-collars-vs-spx-put-tail-hedgesRelated Vix Futures Variance Swap Convexity & Institutional Briefings
Explore Vix Futures Variance Swap Convexity Hub (20) →Vix Futures Variance Swap Convexity
VIX Term Structure, OTC Variance Swaps, VVIX Vol-of-Vol & Tail Hedging GuideVix Futures Variance Swap Convexity
Ultra-Short VIX1D vs VIX9D, VIX & VIX3M Event Term-Structure KinksVix Futures Variance Swap Convexity
Wednesday Morning VIX SOQ Settlement (VRO) & SPX Strip Auction MechanicsVix Futures Variance Swap Convexity
Eurex VSTOXX (FVS) vs Cboe VIX (VX) Cross-Atlantic Volatility SpreadsVix Futures Variance Swap Convexity
Cross-Asset Spillover: CME SOFR Bachelier Swaption Vol & MOVE Into VIXVix Futures Variance Swap Convexity
Volatility Swaps vs Variance Swaps: Exact Vol-of-Vol Convexity PricingVix Futures Variance Swap Convexity
Leveraged & Inverse VIX ETPs (UVIX, SVIX): 16:00 ET TAS Rebalancing FlowsVix Futures Variance Swap Convexity
Cboe SKEW Index Above 150: Risk-Neutral Third Moment vs Crash RealityFX Risk Reversal Strangle Surfaces
FX Reverse Knock-Out (RKO) Barriers: Discontinuous Gamma, Vanna & OverhedgesFX Risk Reversal Strangle Surfaces
New York 10:00 AM Cut vs Tokyo 3:00 PM Expiry: Intraday FX Theta ClocksFX Risk Reversal Strangle Surfaces
CME Listed FX Options (6E, 6J) vs Interbank OTC Smile Basis ArbitrageFX Risk Reversal Strangle Surfaces
FX Cross-Currency Volatility Triangles & Implied Correlation Arbitrage
VolSurface Desk Data, Benchmarks & Contributor Records
CC BY 4.0 Open Data
Open Institutional Datasets (CSV / JSON) →
Download desk-compiled quantitative series & schemas.
2026 Reference Matrix
2026 Institutional Benchmarks & Thresholds →
Statutory capital, clearing, margin & rate conventions.
Editorial Records
Authors & Review Records →
View named contributors where those records are available.
Complete Index
Master Research & Dossier Archive →
Browse all published briefings by topic pillar & date.