
Dealer Gamma Vanna Charm Flows
Net Dealer Gamma Exposure (GEX) Zero-Gamma Flip Points & Volatility Regimes
Calculate institutional net dealer gamma exposure (GEX) across index options, identify the exact zero-gamma flip strike, and model realized volatility jumps when spot breaks lower.
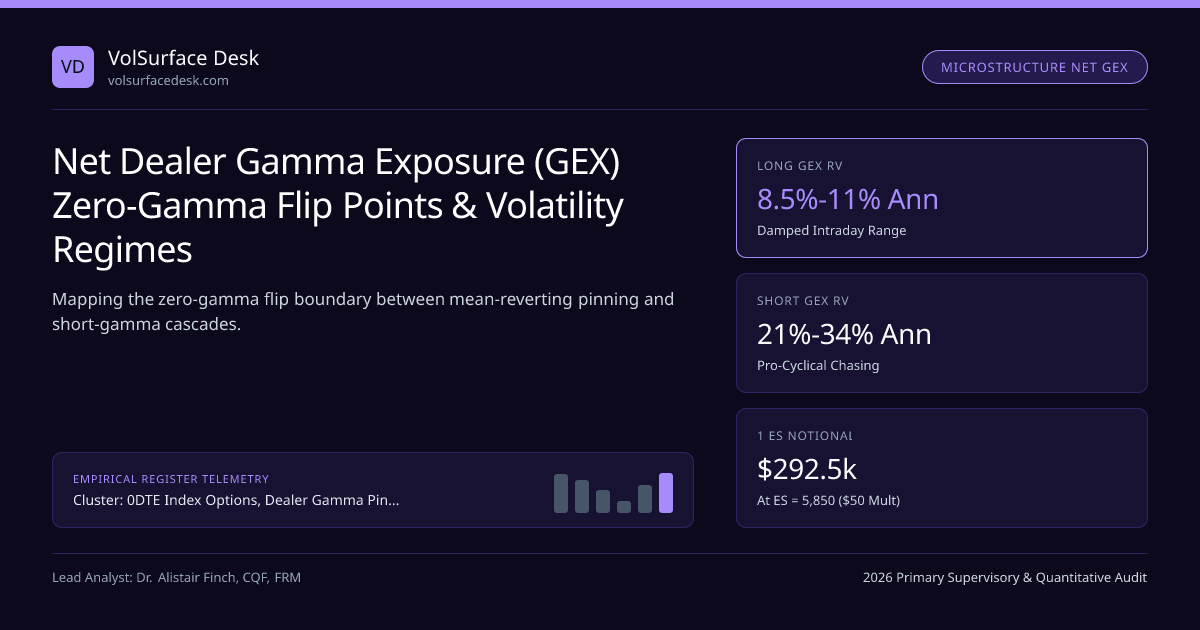
Institutional execution traders treat Net Dealer Gamma Exposure (GEX) not as a directional crystal ball, but as a quantitative gauge of endogenous futures order-book elasticity. Within the 0DTE Index Options, Dealer Gamma Pinning, Vanna & Charm Rehedging framework introduced in our 0DTE Dealer Gamma, Vanna & Charm Flows Guide, the single highest-impact structural coordinate on the morning desk sheet is the Zero-Gamma Flip Strike (S_flip)—the exact S&P 500 level where aggregate market-maker gamma crosses from stabilizing positive territory into destabilizing negative territory.
Deriving the Market-Impact Multiplier Under Dealer Gamma Feedback#
Suppose exogenous macro traders submit net order flow Qexo (in dollars) into CME E-mini S&P 500 (ES) futures, where underlying limit-order-book Kyle lambda (price impact per dollar traded) equals λ > 0. Without options dealers, spot moves by ΔS0 = λ · Qexo. When hedged options market makers carry dollar gamma Γdollar (in dollars hedged per 1-point SPX move), their mechanical delta-rehedging injects an endogenous order Qdealer = −Γdollar · ΔS back into the futures book! Solving ΔS = λ · (Qexo − Γdollar · ΔS) yields the feedback-adjusted volatility multiplier:
- Dollar Gamma per 1% Move ($GEX1%): Σ{K,T} [ Ndealer(K,T) · ΓBSM(S, K, T, σ(K,T)) · S2 · 0.01 · $100 ].
- Stabilizing Regime (Γdollar > 0): Denominator (1 + λ·Γdollar) > 1 Dampens exogenous shocks and compresses realized variance.
- Destabilizing Regime (Γdollar < 0): Denominator (1 − λ·|Γdollar|) < 1 Amplifies price impact non-linearly as |Γ_dollar| approaches 1/λ!
- Worked SPX = 5,850 Example: Let λ = 1.0 pt per $120M ES flow. At +$85M/pt Long GEX, shock impact shrinks by 41.5% (1 / 1.708); at −$65M/pt Short GEX, identical flow produces 2.18x the SPX point move!
Traders calculate exact strike-by-strike $GEX profiles in our Option Greeks & GEX Calculator and compare implied break-even corridors in the 0DTE Expected Move Calculator.
Sticky-Delta Spot-Slide GEX(S) Flip-Strike Computation#
Why Static Spot GEX Misleads: Sticky-Delta Spot-Slide Profiles#
A common retail error is summing ΓBSM(S0, K, T) at the opening print S_0 = 5,850 and plotting strike bars as if each strike's gamma remained constant while spot travels. Because Black-Scholes gamma follows a Gaussian bell curve centered near K ≈ F · exp(1⁄2σ2T) with width proportional to σ√T, moving spot by 60 points completely reshapes which strikes carry peak gamma! Even more critically, an SPX selloff triggers an immediate implied volatility spike—activating Zomma (∂Γ/∂σ) Gamma Profile Shifts that widen downside put gamma bells further out-of-the-money.
Institutional desks on Cboe and CME execution FCMs such as Apex Futures therefore compute a full hypothetical spot-slide curve GEX(S_grid): at every candidate index level S_j ∈ [5,550, 6,150], the engine shifts the entire volatility surface according to empirical spot-vol beta and recomputes aggregate dealer gamma across both multi-week open interest and live SPX 0DTE options (59% volume share).
Comparing Index Regimes Across GEX Zones#
| GEX Regime Zone | Typical Net $GEX (1% Move) | Intraday Realized vs Implied Vol | Optimal Desk Execution & Vol Strategy |
|---|---|---|---|
| Deep Positive Pin | +$5.0B to +$9.5B | Realized vol 3.5–5.5 pts below VIX1D | Fade 1-sigma intraday extensions; harvest short 0DTE/weekly iron flies |
| Transition / Flip Zone | −$1.0B to +$1.0B | Realized ≈ Implied; whippy two-way chop | Reduce delta-scalping frequency; widen Whalley-Wilmott hedge bands |
| Moderate Short Gamma | −$1.5B to −$4.5B | Realized vol 2.5–6.0 pts above prior IV | Own intraday gamma via debit calendars or long straddles; avoid tight condors |
| Deep Short-Gamma Cascade | Below −$5.0B | Nonlinear gap expansion + OCC STANS calls | Monetize OTM put ratios; watch Vanna reversal once event vol peaks |
Separating Multi-Expiry Structural GEX from Ephemeral 0DTE GEX#
A critical operational nuance highlighted in Cboe Open-Close Signed Dealer Positioning is horizon separation. Morning open interest reflects positions held overnight—dominated by monthly OPEX puts, JPMorgan HEQT quarterly collars, and systematic ETF overwrites. However, between 09:30 ET and 11:00 ET, fresh 0DTE trading injects an entirely new intraday gamma layer that does not appear in prior-night OCC open interest! Desks that blend yesterday's static OI with live intraday signed 0DTE tape flow avoid getting trapped fading an apparent morning "long gamma" level that intraday 0DTE put-spread buyers have quietly flipped negative by noon under CFTC and SEC cross-market oversight.
Frequently asked questions
What is the exact formula for 1% Dollar Gamma Exposure ($GEX) on SPX index options?
For each strike K and expiry T with signed dealer inventory N_dealer(K,T) and $100 SPX multiplier, 1% Dollar Gamma equals N_dealer × Γ_BSM(S, K, T, σ) × S2 × 0.01 × 100. Summing across all listed expirations gives aggregate $GEX per 1% SPX move.
Why do public free GEX charts often mislocate the SPX zero-gamma flip point?
Naive public estimators assume dealers are 100% long every listed call and 100% short every listed put in open interest. In reality, customers sell substantial covered calls and buy protective call spreads, shifting the true signed zero-gamma flip by 40 to 90 SPX points.
Should the zero-gamma flip profile be calculated under sticky-strike or sticky-delta assumptions?
Sticky-delta (or spot-vol beta adjusted) is mandatory for equity indices. As SPX drops 2%, ATM implied volatility typically rises 1.8 to 2.5 vol points, altering strike-level gammas via Zomma (∂Γ/∂σ) and shifting the effective flip strike higher.
How much CME ES futures liquidity is required to absorb -$5B of negative dealer GEX?
If dealers carry -$5.0B per 1% move at SPX = 5,850, a -1.0% (-58.5 pt) selloff forces dealers to sell roughly 17,094 CME ES contracts ($5.0B / $292,500 notional per ES), consuming multiple layers of top-of-book Globex depth.
Publication record
- Published
- November 14, 2026
- Updated
- November 14, 2026
- Author
- Dr. Alistair Finch, CQF, FRM
- Review
- Review not recorded
- Automated fact check
- Passed in the stored pipeline record
- Source URLs
- 3 recorded
AI assistance recorded: anthropic/claude-opus-4.6. This field does not establish human review or source verification.
Academic & Institutional Attribution
Cite This Research & Embed Live Data Card
Standard academic & institutional research paper citation format.
Dr. Alistair Finch, CQF, FRM. (2026, November 14). Net Dealer Gamma Exposure (GEX) Zero-Gamma Flip Points & Volatility Regimes. VolSurface Desk. https://volsurfacedesk.com/desk-notes/net-dealer-gamma-exposure-gex-flip-point-mechanicsRelated Dealer Gamma Vanna Charm Flows & Institutional Briefings
Explore Dealer Gamma Vanna Charm Flows Hub (20) →Dealer Gamma Vanna Charm Flows
0DTE Index Options, Net Dealer Gamma (GEX), Vanna & Charm Rehedging Flows GuideDealer Gamma Vanna Charm Flows
Intraday 0DTE SPX Gamma Scalping vs 15:50 ET NYSE MOC Liquidity CollisionsDealer Gamma Vanna Charm Flows
Vanna (∂Δ/∂σ) Mechanical Equity Rallies After CPI & FOMC Volatility CrushesDealer Gamma Vanna Charm Flows
Charm (∂Δ/∂t) Time-Bleed Mechanics: Intraday, Weekend & OPEX Equity DriftDealer Gamma Vanna Charm Flows
Vomma (Volga, ∂2V/∂σ2) Wing Convexity: Why Short 5-Delta Strangles Blow UpDealer Gamma Vanna Charm Flows
Speed (∂Γ/∂S) Third-Order Gamma Gradients & 0DTE Iron Condor Strike CliffsDealer Gamma Vanna Charm Flows
Zomma (∂Γ/∂σ) Mechanics: How Implied Volatility Shocks Mutate Dealer GammaDealer Gamma Vanna Charm Flows
Color (∂Γ/∂t) Gamma Decay vs Final-Hour 0DTE ATM Pin Risk Before 16:00 ETVix Futures Variance Swap Convexity
VIX Futures M1–M2 Contango Roll Bleed & Curve Carry HarvestingVix Futures Variance Swap Convexity
VIX Term-Structure Backwardation, Spot-to-VX Beta & Panic Mean ReversionVix Futures Variance Swap Convexity
OTC S&P 500 Variance Swaps: Vega-to-Variance Notional & Convexity MathVix Futures Variance Swap Convexity
Capped (2.5× Strike) vs Uncapped Variance Swaps: Left-Tail Gap Risk
VolSurface Desk Data, Benchmarks & Contributor Records
CC BY 4.0 Open Data
Open Institutional Datasets (CSV / JSON) →
Download desk-compiled quantitative series & schemas.
2026 Reference Matrix
2026 Institutional Benchmarks & Thresholds →
Statutory capital, clearing, margin & rate conventions.
Editorial Records
Authors & Review Records →
View named contributors where those records are available.
Complete Index
Master Research & Dossier Archive →
Browse all published briefings by topic pillar & date.