
Vix Futures Variance Swap Convexity
Cboe SKEW Index Above 150: Risk-Neutral Third Moment vs Crash Reality
Demystify viral "Cboe SKEW > 155 crash warning" headlines: derive the Bakshi-Kapadia-Madan risk-neutral third-moment normalization S = E[(R − μ)3] / σ3, proving why falling ATM VIX mechanically inflates SKEW!
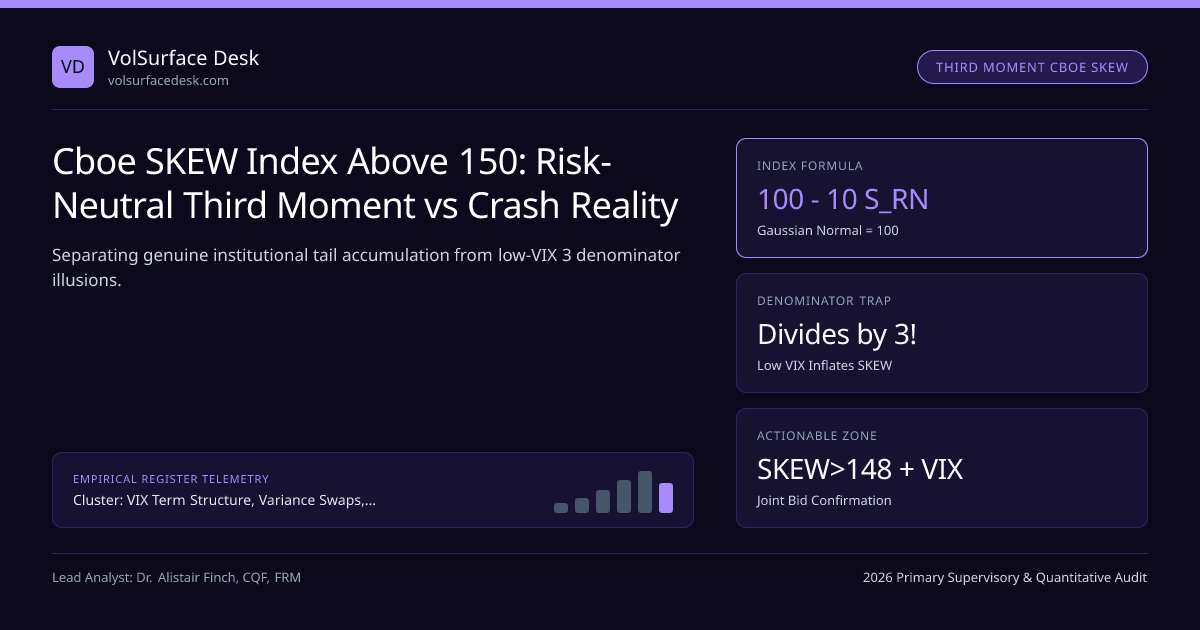
Every few months on financial television, a pundit flashes a scary chart showing the Cboe SKEW Index piercing 155 or 165 alongside a headline warning "Smart Money Is Pricing an Imminent Black Swan Crash!"—only for the S&P 500 to rally +9% over the next quarter! Why do naive commentators misread Cboe SKEW & SPX 25-Delta Skew almost every cycle? Because they never looked at the σ3 denominator inside Bakshi, Kapadia, and Madan's (2003) risk-neutral skewness equation!
Within the VIX Term Structure, Variance Swaps, Vol-of-Vol VVIX & Tail Hedging silo and our VIX, Variance Swaps & Tail Hedging Guide, decomposing SKEW into raw third-moment put demand versus ATM variance compression separates fake alarms from actionable relative-value skew trades.
Exact Bakshi-Kapadia-Madan Cubic-Contract Formula and the σ3 Trap#
Using Carr-Madan spanning on power-log contracts V(t,τ) (quadratic ln2), W(t,τ) (cubic ln3), and X(t,τ) (quartic ln4) across 30-day interpolated OTM Cboe SPX options, standardized risk-neutral skewness S_RN and Cboe SKEW are defined by:
Quantitative Pricing Model: Cboe SKEW Index Above 150 & Tail Risk Pricing Guide#
- Cubic Strip Weighting W(t,τ): Integrates OTM puts (K < F0) with weight −[ 6·ln(F0/K) + 3·(ln(F0/K))2 ] / K2 · Put(K) < 0 ! Notice ln(F0/K) multiplies 1/K2, massively overweighting deep 75%–88% tail puts!
- THE σ3 DENOMINATOR ILLUSION: Notice (Var^Q)^(3/2) = σVIX3 sits in the denominator! If ATM/core VIX drops −20% (from 15.0 to 12.0), σVIX3 drops by (0.80)3 = 0.512 (−48.8%!), nearly DOUBLING |S_RN| even if tail put dollar prices barely moved!
- Worked Comparison of Two SKEW = 156 Prints:
- • Benign Denominator Print (VIX = 11.8, 25d Put-Call Skew = 4.1v, 5d Put = $1.10): Low σ3 = 0.00164 inflates SKEW to 156 via ETF call overwriting!
- • Genuine Tail Bid Print (VIX = 19.4 Rising, 25d Skew = 8.6v, VVIX = 124): High σ3 = 0.00730 STILL yields SKEW = 156 only because institutions bought 4.4x normal cubic tail mass!
Traders verify clean 25-delta and 10-delta implied volatility differences directly in our Implied Volatility Calculator and Black-Scholes Option Calculator.
Institutional Joint (SKEW × VIX) Regime Classification Matrix#
Comparing Skew Metrics Used on Institutional Equity Volatility Desks#
Because Cboe SKEW conflates third-moment wing curvature with σ3 ATM level, bank desks monitor four complementary skew gauges side by side:
| Desk Skew Metric | Exact Mathematical Definition | Affected by ATM Level σ? | Primary Trading Application |
|---|---|---|---|
| Raw 25d Put–Call Skew | σ(25d Put) − σ(25d Call) (Vol pts) | Yes (scales up in high VIX) | Pricing quarterly equity collars |
| Normalized Skew Slope | [ σ(90% K) − σ(100% K) ] / σ(100% K) | Normalized linearly (1/σ) | Cross-regime comparison of SSVI ρ parameter |
| Cboe SKEW Index | 100 − 10 · μ3 / σ3 | Heavily (1/σ3 cubic!) | Pricing deep 2d–5d tail options & 2.5× variance caps |
| 25d / 5d Put Convexity Ratio | σ(5d Put) / σ(25d Put) | Minimal | Sizing defined-risk Broken-Wing Put Butterflies |
Forward 30-Day S&P 500 Behavior Across Joint (SKEW × VIX) Quadrants#
Look at Bar 2 (Low SKEW < 125 + Low VIX < 14): paradoxically, the single best moment for a portfolio manager to buy SPX put spreads or VIX call collars is when Cboe SKEW is unusually LOW, meaning nobody is bidding up left-tail kurtosis!
Frequently asked questions
What does a Cboe SKEW print of 150 vs 115 mean in plain probability units?
If 30-day S&P 500 log-returns were Gaussian (zero skewness S_RN = 0), Cboe SKEW would equal exactly 100! SKEW = 115 implies S_RN = -1.5 (moderate left tail, ~6.5% risk-neutral 2-SD crash odds), whereas SKEW = 150 implies S_RN = -5.0 (~14.5% risk-neutral probability of a >2-SD drop)!
Why does Cboe SKEW hit all-time highs (155–170) during quiet bull markets rather than during crashes?
During an actual crash (March 2020), ATM implied volatility (σ in the σ3 denominator!) explodes from 13% to 65%, homogenizing the smile and plunging Cboe SKEW DOWNWARD toward 112–120! In quiet bull markets, ATM σ drops to 11% (shrinking σ3 by 80%!) while tail hedge funds keep bidding 5-delta puts!
How does Bakshi-Kapadia-Madan option-strip weighting differ between VIX and SKEW?
VIX replicates the quadratic second moment (ln S)2 using flat 1/K2 strike weights. Cboe SKEW replicates the CUBIC third moment (ln S)3 using weights proportional to [1 - ln(K/F0)] / K2—giving deep 2-delta to 10-delta OTM puts 3x to 5x heavier relative leverage than in VIX!
How do volatility desks monetize extreme Cboe SKEW > 158 readings safely?
Never sell naked 5-delta tail puts (Vomma suicide)! Instead, desks buy cheap 35-delta SPX puts and sell 1.6x 15-delta puts capped with long 5-delta tail wings ("Broken-Wing Put Butterfly"), or buy depressed 25-delta calls against overbid puts when ETF overwriting distorts SKEW.
Publication record
- Published
- November 13, 2026
- Updated
- November 14, 2026
- Author
- Dr. Alistair Finch, CQF, FRM
- Review
- Review not recorded
- Automated fact check
- Passed in the stored pipeline record
- Source URLs
- 3 recorded
AI assistance recorded: anthropic/claude-opus-4.6. This field does not establish human review or source verification.
Academic & Institutional Attribution
Cite This Research & Embed Live Data Card
Standard academic & institutional research paper citation format.
Dr. Alistair Finch, CQF, FRM. (2026, November 14). Cboe SKEW Index Above 150: Risk-Neutral Third Moment vs Crash Reality. VolSurface Desk. https://volsurfacedesk.com/desk-notes/cboe-skew-index-above-150-tail-kurtosis-pricingRelated Vix Futures Variance Swap Convexity & Institutional Briefings
Explore Vix Futures Variance Swap Convexity Hub (20) →Vix Futures Variance Swap Convexity
VIX Term Structure, OTC Variance Swaps, VVIX Vol-of-Vol & Tail Hedging GuideVix Futures Variance Swap Convexity
Forward-Starting Variance Swaps vs FVAs: Election & Macro Event CarryVix Futures Variance Swap Convexity
Spot-Weighted Gamma Swaps vs Variance Swaps: Taming Crash TruncationVix Futures Variance Swap Convexity
CFTC Traders in Financial Futures (TFF) VIX Positioning & Squeeze SignalsVix Futures Variance Swap Convexity
CFE & OCC VIX Futures–Options Cross-Margining & Capital OptimizationVix Futures Variance Swap Convexity
Cboe VIX Model-Free Log-Strip Replication & Strike Truncation BiasVix Futures Variance Swap Convexity
VIX Futures M1–M2 Contango Roll Bleed & Curve Carry HarvestingVix Futures Variance Swap Convexity
VIX Term-Structure Backwardation, Spot-to-VX Beta & Panic Mean ReversionFX Risk Reversal Strangle Surfaces
FX Variance Swaps vs Forward Volatility Agreements (FVAs) Desk GuideFX Risk Reversal Strangle Surfaces
Corporate FX Target Redemption Forwards (TARFs) & KIKO Gamma TrapsFX Risk Reversal Strangle Surfaces
Calibrating Stochastic Local Volatility (Heston-SLV) to FX Surfaces & BarriersFX Risk Reversal Strangle Surfaces
ISDA SIMM Initial Margin for OTC FX Options: Vega & Curvature Buckets
VolSurface Desk Data, Benchmarks & Contributor Records
CC BY 4.0 Open Data
Open Institutional Datasets (CSV / JSON) →
Download desk-compiled quantitative series & schemas.
2026 Reference Matrix
2026 Institutional Benchmarks & Thresholds →
Statutory capital, clearing, margin & rate conventions.
Editorial Records
Authors & Review Records →
View named contributors where those records are available.
Complete Index
Master Research & Dossier Archive →
Browse all published briefings by topic pillar & date.