
Vix Futures Variance Swap Convexity
Cboe VVIX Vol-of-Vol & Jensen’s Inequality: The VIX Futures Convexity Wedge
Prove why a Cboe VX future MUST trade below its matching forward SPX variance swap strike: exact derivation of the VVIX vol-of-vol Jensen concavity discount and how institutional desks replicate forward variance using VIX option strips!
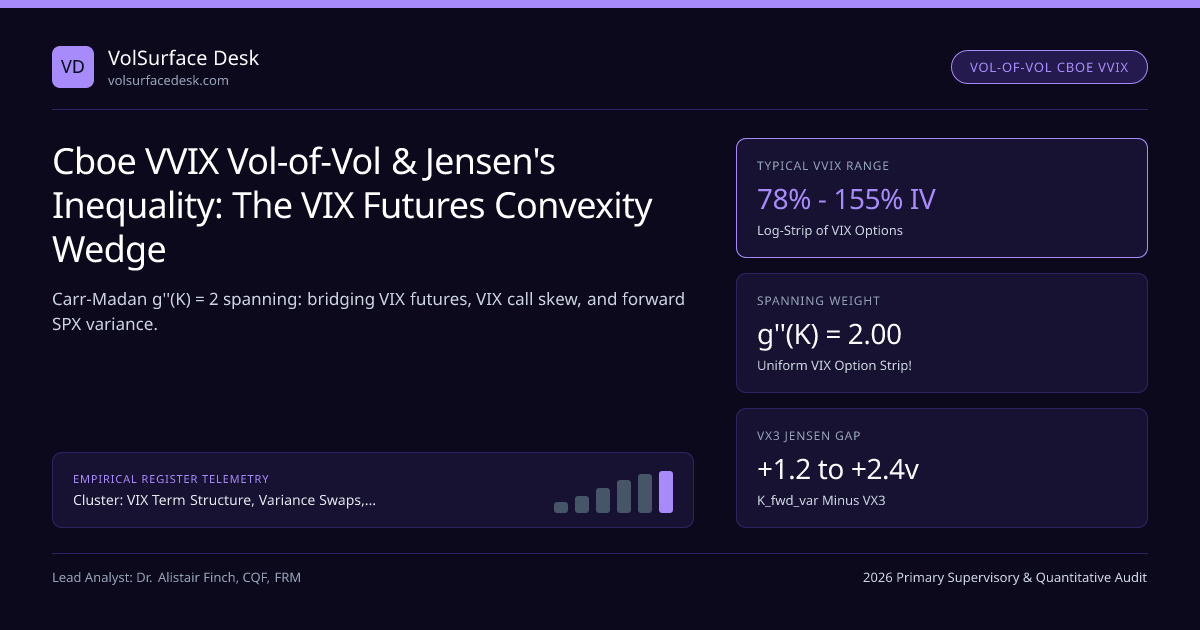
Why does a 3-month Cboe VIX future (VX3) trade at 17.50 on the exact same afternoon that a 3-month-forward 30-day S&P 500 variance swap (K_fwd(60d, 90d)) trades at 19.15—a +1.65 vol-point gap on the exact same underlying 30-day S&P 500 variance window? Beginners guess credit risk or liquidity friction; quantitative volatility traders know it is Jensen's concavity inequality driven directly by Cboe VVIX (Volatility of VIX)!
Within the VIX Term Structure, Variance Swaps, Vol-of-Vol VVIX & Tail Hedging silo and our VIX, Variance Swaps & Tail Hedging Guide, the exact mathematical bridge linking SPX Options ↔ Forward Variance ↔ VX Futures ↔ VIX Options is one of the sharpest relative-value arbitrage equations in institutional finance.
Exact Carr-Madan Spanning Identity: Why VIX2 Weights VIX Options by Constant 2!#
At future Wednesday settlement T, the expiring VX future converges to VIXT, whose square VIXT2 represents 30-day forward SPX variance Kfwd2(T, T+30d) (up to SPX truncation bias). Apply the Carr-Madan (1998) static spanning theorem g(XT) = g(F) + g'(F)(XT − F) + ∫ g''(K) Q(K) dK to the quadratic payoff g(X) = X2 centered at today's VIX future FVX = E^Q[VIX_T]:
- Since g(X) = X2, its second derivative is g''(K) = 2—a constant across every VIX strike K!
- Taking risk-neutral expectations immediately proves the Exact VIX-Variance Bridge:
Quantitative Pricing Model: Cboe VVIX Vol-of-Vol & Jensen VIX Futures Wedge Guide#
- Lognormal VVIX Approximation: If VIXT were lognormal with vol-of-vol σVVIX, E^Q[VIXT2] = FVX2 · exp(σVVIX2 · T) => Kfwd ≈ FVX · exp(1⁄2 · σVVIX2 · T)!
- Right-Wing Dominance: Because g′′(K) = 2 does NOT decay like 1/K2, expensive OTM VIX 35, 50, and 70 Calls contribute MASSIVELY to the integral!
- Worked Arbitrage Check (T = 0.20 yr [73d], VX3 = 17.50 [F_VX2 = 306.25], Equal-Weight VIX Option Strip = $30.40 => 2·e^(rT)·30.40 = 61.35 var pts):
- Implied VIX-Strip Variance = 306.25 + 61.35 = 367.60 => Implied K_fwd = √367.60 = 19.17 vol! If OTC SPX Forward Variance quotes at 19.85v (+0.68v rich!), sell SPX Fwd Var & buy VX3 + VIX Call Strip!
Traders price individual Black-76 OTM VIX calls off F_VX in our Black-Scholes Option Calculator and invert VIX right-wing implied volatilities in the Implied Volatility Calculator.
The SPX Forward Variance vs VIX Option Strip Arbitrage Triangle#
Comparing SPX Surface Geometry vs VIX Surface Geometry#
New volatility traders often make catastrophic mistakes applying equity-option intuition to Cboe VIX options. Every structural sign is inverted:
| Surface Property | Cboe SPX Index Options | Cboe VIX Volatility Options | Pricing & Hedging Consequence |
|---|---|---|---|
| Underlying Pricing Forward | Cash Spot S · e^((r−q)T) | Specific Monthly VX_m Future! | Never plug Spot VIX into a VIX option calculator! |
| Implied Volatility Skew Sign | Negative Put Skew (25d Put >> 25d Call) | Positive Call Skew (10d Call = 160% IV >> Put 70%) | VIX call spreads price steep right-tail jump kurtosis |
| Spot-to-Vol Correlation (ρ) | Negative (SPX down → SPX IV up) | Strongly Positive (VX up → VVIX explodes!) | Long OTM VIX calls carry twin Gamma + Vanna acceleration! |
| Final-Week Pin Behavior | Cash close 16:00 ET | Wednesday AM VRO SOQ (see SOQ note) | VIX deltas must hedge in matching VX_m future |
Jensen Concavity Wedge (KfwdSPX − F_VX) by Maturity & VVIX#
Executing this cross-market arbitrage inside an OCC–CFE Cross-Margining account lets market makers police the boundary between SPX skew and VIX call wings to within fractions of a vol point.
Frequently asked questions
Why does replicating forward SPX variance via VIX options weight every VIX strike equally by 2 instead of 1/K2?
By Carr-Madan payoff spanning, any twice-differentiable payoff g(X_T) expands around F as g(F) + g’(F)(X_T - F) + ∫ g’’(K) Q(K) dK! For X_T = VIX_T and g(X) = X2 (variance!), the second derivative g’’(K) = d2(K2)/dK2 = 2—a CONSTANT independent of strike K!
How big is the Jensen convexity wedge between VX3 futures and 60-to-90 day forward SPX variance?
Suppose VX3 (T = 0.20 yr) trades at 17.50 and VVIX across that horizon is 95% (σ_VVIX = 0.95). Using E[V] ≈ F_VX2 · exp(σ_VVIX2 · T) = 306.25 × exp(0.9025 × 0.20) = 366.8 => Forward Variance Strike K_fwd = √366.8 = 19.15—a massive +1.65 vol-point wedge!
How do relative-value desks arbitrage mismatches between SPX forward variance and VIX options?
If forward SPX variance swaps trade RICHER than [F_VX2 + 2·e^(rT)·∫ Q_VIX(K) dK], desks SELL forward SPX variance (via SPX calendar log-strips) and BUY the constant-weight strip of VIX puts and OTM VIX calls plus VIX futures—locking in model-free VIX-SPX convexity arbitrage!
Why do VIX options exhibit a steep POSITIVE call skew (opposite to SPX put skew)?
When S&P 500 crashes, VIX jumps upward discontinuously from 15 toward 50–80 (positive jump skewness in volatility!). Consequently, 10-delta OTM VIX 45 Calls trade at 140%–190% Black-76 implied vol while OTM VIX 13 Puts trade near 65%–80% IV!
Publication record
- Published
- November 13, 2026
- Updated
- November 14, 2026
- Author
- Dr. Alistair Finch, CQF, FRM
- Review
- Review not recorded
- Automated fact check
- Passed in the stored pipeline record
- Source URLs
- 3 recorded
AI assistance recorded: anthropic/claude-opus-4.6. This field does not establish human review or source verification.
Academic & Institutional Attribution
Cite This Research & Embed Live Data Card
Standard academic & institutional research paper citation format.
Dr. Alistair Finch, CQF, FRM. (2026, November 15). Cboe VVIX Vol-of-Vol & Jensen’s Inequality: The VIX Futures Convexity Wedge. VolSurface Desk. https://volsurfacedesk.com/desk-notes/vvix-vol-of-vol-jensen-inequality-vix-futures-wedgeRelated Vix Futures Variance Swap Convexity & Institutional Briefings
Explore Vix Futures Variance Swap Convexity Hub (20) →Vix Futures Variance Swap Convexity
VIX Term Structure, OTC Variance Swaps, VVIX Vol-of-Vol & Tail Hedging GuideVix Futures Variance Swap Convexity
VIX 1×2 Call Ratios & Collars vs Direct SPX OTM Put Tail HedgesVix Futures Variance Swap Convexity
Ultra-Short VIX1D vs VIX9D, VIX & VIX3M Event Term-Structure KinksVix Futures Variance Swap Convexity
Wednesday Morning VIX SOQ Settlement (VRO) & SPX Strip Auction MechanicsVix Futures Variance Swap Convexity
Eurex VSTOXX (FVS) vs Cboe VIX (VX) Cross-Atlantic Volatility SpreadsVix Futures Variance Swap Convexity
Cross-Asset Spillover: CME SOFR Bachelier Swaption Vol & MOVE Into VIXVix Futures Variance Swap Convexity
Volatility Swaps vs Variance Swaps: Exact Vol-of-Vol Convexity PricingVix Futures Variance Swap Convexity
Leveraged & Inverse VIX ETPs (UVIX, SVIX): 16:00 ET TAS Rebalancing FlowsFX Risk Reversal Strangle Surfaces
Vanna-Volga & First-Exit Attenuation on FX Double-No-Touch (DNT) BarriersFX Risk Reversal Strangle Surfaces
FX Reverse Knock-Out (RKO) Barriers: Discontinuous Gamma, Vanna & OverhedgesFX Risk Reversal Strangle Surfaces
New York 10:00 AM Cut vs Tokyo 3:00 PM Expiry: Intraday FX Theta ClocksFX Risk Reversal Strangle Surfaces
CME Listed FX Options (6E, 6J) vs Interbank OTC Smile Basis Arbitrage
VolSurface Desk Data, Benchmarks & Contributor Records
CC BY 4.0 Open Data
Open Institutional Datasets (CSV / JSON) →
Download desk-compiled quantitative series & schemas.
2026 Reference Matrix
2026 Institutional Benchmarks & Thresholds →
Statutory capital, clearing, margin & rate conventions.
Editorial Records
Authors & Review Records →
View named contributors where those records are available.
Complete Index
Master Research & Dossier Archive →
Browse all published briefings by topic pillar & date.