
FX Risk Reversal Strangle Surfaces
Sticky-Strike vs Sticky-Delta FX Smiles: Shadow-Delta Hedging Math
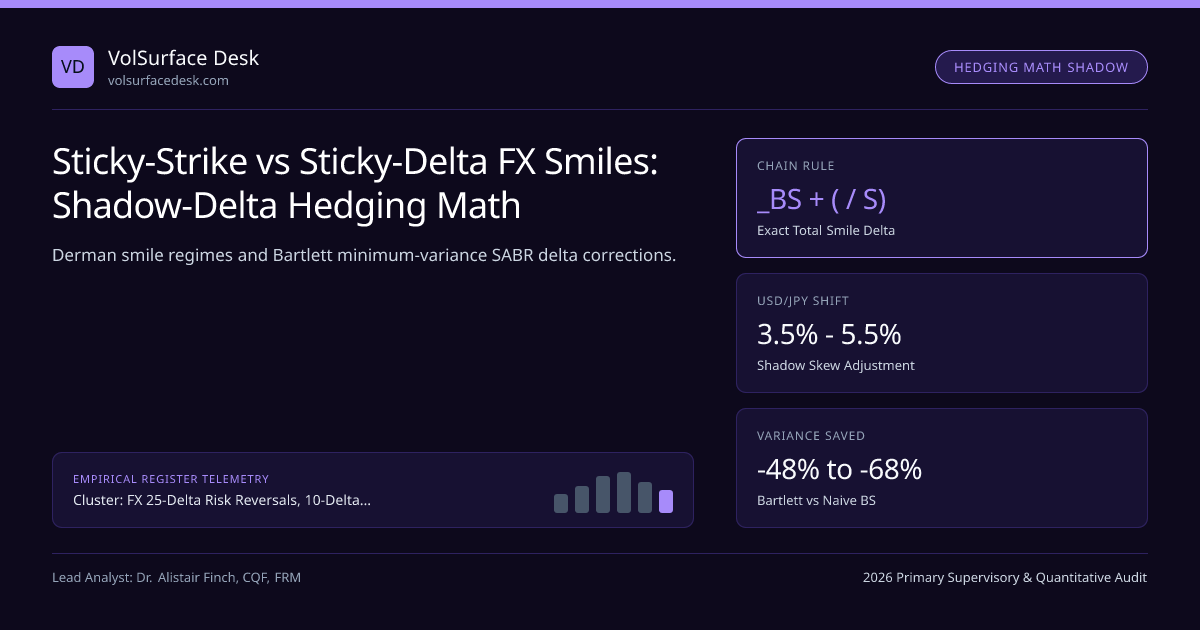
Stop bleeding rehedging P&L from naive Black-Scholes deltas: derive exact Total Smile Shadow Delta Δ_total = Δ_BS + Vega · (∂σ/∂S) across Sticky-Strike, Sticky-Moneyness (Sticky-Delta), and SABR backbone regimes.
Suppose you buy a 3-month ATM EUR/USD or USD/JPY straddle (ΔBSCall + ΔBSPut = 0.00) on a steep-skew volatility surface and sit back believing you are 100% delta-neutral to small spot moves! Spot drops 80 pips, implied volatility jumps +0.65 vol points along the carry-unwind backbone, and your supposedly "delta-neutral" straddle suddenly posts an unhedged directional windfall (or loss if short!)! Why? Because Black-Scholes Δ_BS holds implied volatility artificially frozen (∂σ/∂S = 0)!
Within the FX 25-Delta Risk Reversals, 10-Delta Butterflies & Event Vol Weights silo and our FX Volatility Surfaces & Event Vol Guide, institutional desks hedge Minimum-Variance Total (Shadow) Delta—unifying Emanuel Derman's (1999) sticky regimes with Patrick Bartlett's (2006) exact SABR backbone correction.
Total Chain-Rule Delta Across Sticky-Strike, Sticky-Delta, and Bartlett-SABR#
Applying the total derivative dV / dS to VBS(S, K, T, σimp(K; S, α)) decomposes true hedging delta into Black-Scholes Partial Delta plus Vega × Expected Implied-Vol Shift per Unit Spot:
Quantitative Pricing Model: Sticky-Strike vs Sticky-Delta FX Shadow Delta Hedging Guide#
- 1. Sticky-Strike Regime (Rangebound Pinning): E[dσ(K)/dS] = 0 ==> Δtotal = ΔBS.
- 2. Pure Sticky-Moneyness σ_imp = f(ln(K/F)) (Constant ATM Vol!): ∂σ(K)/∂S = −(1 / S) · (∂σ / ∂lnK)! Note: If skew ∂σ/∂lnK < 0, fixed strike K slides into higher-put-vol moneyness when S rises!
- 3. Bartlett (2006) Correlated SABR / Empirical Backbone Regime (Spot Crash Spikes ATM α via ρ < 0!):
- E[dσ(K)/dS] = ∂σSABR/∂F + (ρ · ν / (α · F^(1−β))) · (∂σSABR / ∂α) ==> For ρ < 0, ∂σ_ATM/∂S < 0 shifts ATM Straddle Delta NEGATIVE by −3% to −6%!
- Worked $100M 3M USD/JPY ATM Straddle Hedge (S = 152.00, σ_ATM = 10.0%, Vega = $194,000 per 1% vol, Empirical Spot-Vol Beta dσ/dS = −0.38% vol per −1.00 JPY drop [i.e. +0.38v when S drops]):
- Wait: dσ / dS = −0.38 vol / (+1.00 JPY)! Thus Vega · (dσ/dS) = $194,000 × (−0.38) = −$73,720/JPY = −$11.20M USD Shadow Delta (−11.2% Δ!)! To be minimum-variance neutral, a LONG straddle holder must BUY +$11.2M USD/JPY upfront!
Traders inspect raw Black-Scholes ΔBS and VegaBS in our Black-Scholes Option Calculator before layering empirical dσ/dS shadow-delta adjustments.
Smile-Consistent Shadow-Delta Hedging Architecture#
Comparing the Four Classic Smile-Dynamics Regimes on FX & Index Desks#
Notice why confusing Sticky-Moneyness with Correlated Backbone (Dupire Local Vol / Bartlett SABR) causes traders to put on the exact wrong sign of shadow-delta hedge!
| Smile Dynamics Model | Assumption When Spot S Drops −1% | Resulting dσ(K_ATM)/dS Sign (When Skew < 0) | Best Empirical Market Fit |
|---|---|---|---|
| Sticky-Strike | Every fixed strike K keeps exact old IV | 0.00 (Δtotal = ΔBS) | Range-bound FX inside positive GEX pins |
| Sticky-Moneyness (Pure Sticky-Δ) | Entire smile σ(K/F) shifts left with F; ATM IV stays flat! | Positive (σ(old ATM) drops onto lower call wing!) | Calm trending G10 currency drifts |
| Dupire Local Vol | Static deterministic σ_loc(S, t) surface | Negative (2× skew slope!) — over-predicts skew flattening | Path-dependent barrier PDE baseline |
| Bartlett SABR / SLV | Smile shifts WITH correlated dα jump (ρ < 0)! | Strongly Negative (ATM IV rises as S drops!) | USD/JPY, AUD/USD, USD/MXN & SPX! |
Unexplained Daily Hedging P&L Error Across Four Delta Rules#
Look at Bar 1 (Sticky-Moneyness is +18% WORSE than naive Black-Scholes during carry panics!): that single insight explains why quantitative FX desks calibrate Bartlett SABR or Heston-SLV mixing before hedging any directional skew or barrier book!
Frequently asked questions
What is the exact sign of ∂σ(K)/∂S under Sticky-Delta on a negatively skewed smile like USD/JPY?
Suppose USD/JPY has negative skew so downside strikes carry higher vol (∂σ/∂K < 0). Under pure Sticky-Delta σ(K/F) with constant ATM vol, if spot S rises, moneyness K/F shrinks into the steeper put wing so σ(K) rises: ∂σ/∂S = −(K/S)·(∂σ/∂K) > 0. During risk-off crashes, however, ATM volatility itself jumps sharply, dominating the horizontal shift!
Why do SPX equity indices violate pure Sticky-Delta while rangebound G10 FX often obeys Sticky-Strike?
Emanuel Derman (1999) classified three regimes: (1) Rangebound mean-reverting FX (EUR/USD) often behaves near Sticky-Strike (∂σ(K)/∂S ≈ 0); (2) Trending FX with constant ATM vol behaves Sticky-Delta (smile slides horizontally with F); and (3) Fear-driven pairs (SPX, USD/JPY crash) exhibit Sticky-Local-Vol / Negative Backbone where ATM vol itself jumps when S falls!
How does Hagan’s SABR model resolve the Sticky-Strike vs Sticky-Delta debate analytically?
In lognormal SABR (β = 1), backbone ATM volatility stays flat as F moves unless correlated via ρ! Specifically, Bartlett’s (2006) minimum-variance SABR delta proves Δ_Bartlett = Δ_BS + Vega · [ ∂σ_SABR/∂F + (ρ · ν / α) · ∂σ_SABR/∂α ]—cutting hedging P&L variance by 45% to 70% over naive Black-Scholes delta!
How big is the Shadow-Delta adjustment in basis points of notional on a 3-month 25-delta USD/JPY option?
On a 3M ATM or 25d USD/JPY option where skew slope ∂σ/∂lnK ≈ -0.18 and Bartlett spot-vol beta ∂σ/∂lnS ≈ -0.22, Vega/(S) ≈ 0.20, giving a Shadow-Delta shift of -0.044 (-4.4% delta!)—meaning hedging at -0.250 instead of -0.294 leaves $4.4M unhedged per $100M ticket!
Publication record
- Published
- November 13, 2026
- Updated
- November 14, 2026
- Author
- Dr. Alistair Finch, CQF, FRM
- Review
- Review not recorded
- Automated fact check
- Passed in the stored pipeline record
- Source URLs
- 3 recorded
AI assistance recorded: anthropic/claude-opus-4.6. This field does not establish human review or source verification.
Academic & Institutional Attribution
Cite This Research & Embed Live Data Card
Standard academic & institutional research paper citation format.
Dr. Alistair Finch, CQF, FRM. (2026, November 14). Sticky-Strike vs Sticky-Delta FX Smiles: Shadow-Delta Hedging Math. VolSurface Desk. https://volsurfacedesk.com/desk-notes/sticky-strike-vs-sticky-delta-fx-shadow-delta-hedgingRelated FX Risk Reversal Strangle Surfaces & Institutional Briefings
Explore FX Risk Reversal Strangle Surfaces Hub (20) →FX Risk Reversal Strangle Surfaces
FX Volatility Surfaces: 25-Delta Risk Reversals, 10d Butterflies & Event Vol GuideFX Risk Reversal Strangle Surfaces
Vanna-Volga & First-Exit Attenuation on FX Double-No-Touch (DNT) BarriersFX Risk Reversal Strangle Surfaces
FX Reverse Knock-Out (RKO) Barriers: Discontinuous Gamma, Vanna & OverhedgesFX Risk Reversal Strangle Surfaces
New York 10:00 AM Cut vs Tokyo 3:00 PM Expiry: Intraday FX Theta ClocksFX Risk Reversal Strangle Surfaces
CME Listed FX Options (6E, 6J) vs Interbank OTC Smile Basis ArbitrageFX Risk Reversal Strangle Surfaces
FX Cross-Currency Volatility Triangles & Implied Correlation ArbitrageFX Risk Reversal Strangle Surfaces
Cross-Currency CIP Basis Swaps & FX Forward-Point Volatility in OptionsFX Risk Reversal Strangle Surfaces
Power Reverse Dual-Currency (PRDC) Notes & Long-Dated USD/JPY SkewIndex Dispersion Correlation Desk
Implied Correlation Skew: Why 90% Put Correlation Beats 110% Calls by 25+ PtsIndex Dispersion Correlation Desk
OTC Clean Correlation Swaps vs Option-Strip "Dirty" Dispersion MechanicsIndex Dispersion Correlation Desk
Two-Tier Sector Dispersion: SPX vs Sector ETFs (XLK, XLF, XLE, XLV) vs StocksIndex Dispersion Correlation Desk
Post-Earnings Volatility Crush & PEAD Calendar / Diagonal Option Spreads
VolSurface Desk Data, Benchmarks & Contributor Records
CC BY 4.0 Open Data
Open Institutional Datasets (CSV / JSON) →
Download desk-compiled quantitative series & schemas.
2026 Reference Matrix
2026 Institutional Benchmarks & Thresholds →
Statutory capital, clearing, margin & rate conventions.
Editorial Records
Authors & Review Records →
View named contributors where those records are available.
Complete Index
Master Research & Dossier Archive →
Browse all published briefings by topic pillar & date.