
Index Dispersion Correlation Desk
Nasdaq-100 (NDX / VXN) Tech & Semiconductor Dispersion vs S&P 500
With Cboe VXN averaging 4 to 7 vol points above VIX and AI semiconductors swinging ±9% on capex guidance, Nasdaq-100 dispersion offers twice the raw volatility amplitude of SPX—if you master Tech Rate Beta and Earnings Sympathy!
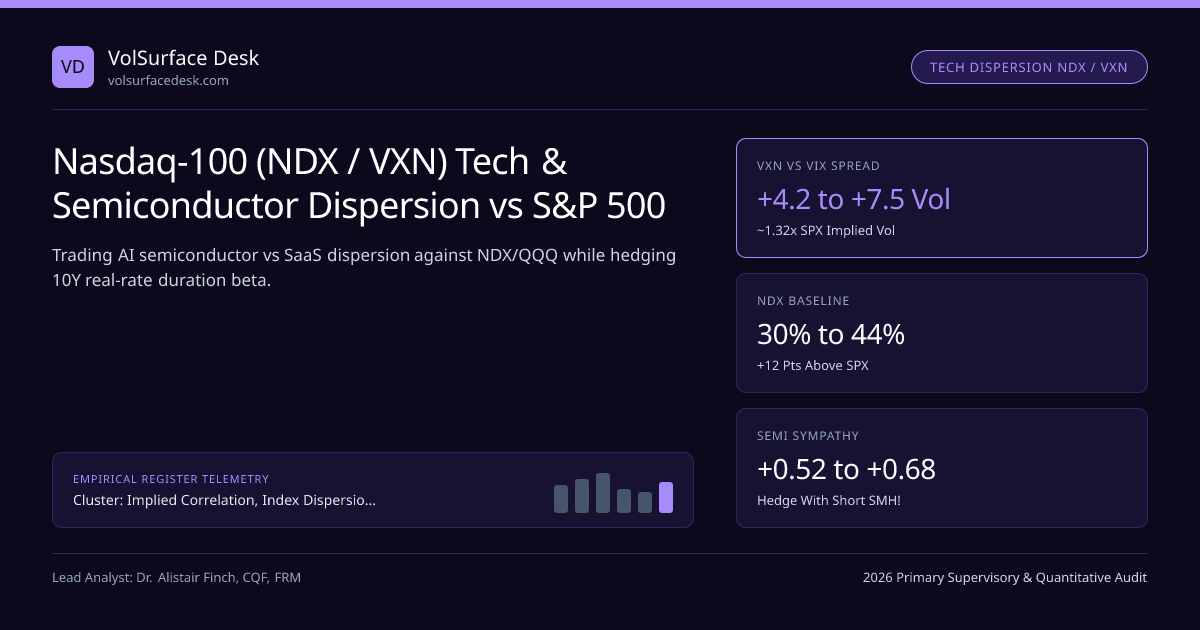
Over the past five years, the focal point of US equity options volume has shifted decisively toward Nasdaq-100 (NDX / QQQ) Gamma and its Top-15 AI hardware and cloud constituents. With Cboe VXN averaging 18%–23% when Cboe VIX sits at 13.5%–16.5%, and single-stock options on Nvidia, Broadcom, Tesla, Meta, and Palantir trading at 38%–62% implied volatility, Nasdaq-100 dispersion offers nearly double the gross variance spread of traditional S&P 500 dispersion—accompanied by two unique quantitative hazards: 10-Year Real-Yield Duration Synchronization and Semiconductor Earnings Sympathy.
Within our Implied Correlation, Index Dispersion Baskets & Earnings Vol Crush silo and Dispersion Desk Manual, structuring a profitable NDX dispersion book requires explicitly modeling Sub-Sector Sympathy Covariance.
Exact NDX Variance Equation With Semiconductor Sympathy Read-Through#
In our earlier Pre-Earnings Jump Extraction note, corporate earnings jumps across unrelated S&P 500 industries (say John Deere and Netflix) satisfied Cov(Ji, Jj) ≈ 0. Inside Nasdaq-100, that zero-covariance assumption fails! When Microsoft and Alphabet announce +$25B in AI data-center capex on Tuesday night, Nvidia, Broadcom, AMD, and Micron all gap +5% to +8% simultaneously before reporting their own numbers three weeks later!
- Numerical Proof of Why Sympathy Correlation Doubles NDX Earnings Jump Variance:
- Take a 6-stock AI Cluster summing to ∑ wi = 28% of NDX with individual jump std dev σearn,i = ±8.0% (0.08):
- • Zero-Sympathy Assumption (ρsympathy = 0, wi ≈ 4.67% each): ∑ wi2 σearn2 = 6 × (0.0467)2 × 0.0064 = 0.0000837 ⇒ Just ±0.91% NDX jump!
- • Empirical AI Sympathy Reality (ρ_sympathy = +0.55 across all 30 off-diagonal pairs!): Off-diagonal term adds 30 × (0.0467)2 × 0.55 × 0.0064 = +0.000230 ⇒ Total NDX Jump = √(0.000314) = ±1.77% (Nearly 2.0x larger NDX move!!).
Price NDX, QQQ, and constituent semiconductor straddles side-by-side in our Option Greeks & GEX Calculator and Black-Scholes Calculator.
Institutional Nasdaq-100 (NDX) Dispersion Architecture & Rate Filter#
The AI Hardware vs Legacy Software Bifurcation: Pure NDX Dispersion Fuel!#
Look at Metric #2 in the exhibit above (AI vs SaaS Correlation = +0.12 to +0.28): during 2024–2026, a powerful structural dispersion theme emerged inside Nasdaq-100! Whenever enterprise CIOs diverted IT budgets away from seat-based SaaS software (Adobe, Salesforce, Workday) into GPU compute clusters (Nvidia, Broadcom, Micron), semiconductors surged +15% while software dropped −15%, holding headline NDX steady at +1%! Desks running a balanced AI-Hardware + SaaS + Biotech/Retail constituent basket against 75% NDX + 25% SMH harvested +14 to +19 correlation points of realized alpha!
S&P 500 (SPX) vs Nasdaq-100 (NDX) Dispersion Comparison#
| Dispersion Dimension | S&P 500 Index (SPX / VIX) | Nasdaq-100 Index (NDX / VXN) | Relative-Value Desk Implication |
|---|---|---|---|
| 30-Day Index ATM IV | 12.5% – 16.5% | 17.0% – 23.5% | NDX pays ~1.35x higher short index Theta per unit $Γ |
| Weighted Stock ATM IV | 25.0% – 30.0% | 33.0% – 44.0% | Larger absolute variance spread on NDX legs |
| Calm Realized Correlation | 13% – 21% (11 GICS Sectors) | 28% – 39% (Tech-Concentrated) | Require higher implied ρ hurdle (>38%) on NDX! |
| Primary Macro Enemy | Credit / Recession / Yen Liquidation | 10Y Real Yield Spike (2022 Rate Bear!) | Pair NDX dispersion with CME SOFR rate-vol awareness |
| Index Options Settlement | Cboe SPX / SPXW (Sec. 1256) | Cboe NDX / NDXP / XND (Sec. 1256) + QQQ | Cross-margin SPX vs NDX dispersion at OCC STANS |
Nasdaq-100 Realized Pairwise Correlation Across Macro & Tech Regimes#
Notice the final metric (Tech Worst-Of Notes): why are bank exotic desks constantly offering cheap implied correlation on baskets of Nvidia, Apple, Tesla, and AMD? Because retail investors in Asia, Europe, and the US buy $100B+ per year of Worst-Of Autocallable Structured Notes—our next deep dive! Compare live parameters in Worst-of Autocallable Notes & Bank Correlation Supply.
Frequently asked questions
What is Cboe VXN and how does the VXN-minus-VIX spread guide tech dispersion?
Cboe Nasdaq-100 Volatility Index (VXN) applies the exact VIX 30-day model-free option-strip formula to NDX options. Historically VXN trades +4.0 to +6.5 vol points above VIX (~1.30x ratio). When VXN − VIX stretches past +7.5 vol points ahead of Mega-Cap Tech Earnings Week, selling NDX volatility against SPX or non-semi NDX constituents captures peak tech index fear!
Why does Nasdaq-100 enforce Modified Market-Cap Weighting Rules unlike pure cap-weighted SPX?
Nasdaq-100 rebalances quarterly (and triggers special rebalances like July 2023!) whenever companies exceeding 4.5% individual weight sum to more than 48% of the index, capping aggregate mega-cap share back toward 40%. Dispersion desks must update NDX constituent weights immediately around quarterly March/June/September/December rebalance Fridays!
Should NDX dispersion desks execute the index leg in NDX, NQX, QQQ, or MNQ options?
Institutional desks above $50M notional strongly prefer European cash-settled NDX (or 1/5th-sized XND) options on Cboe for zero early-exercise risk and 60/40 Section 1256 tax/clearing efficiency, while using QQQ options when tighter penny-pilot intraday strike granularity is needed.
How do you hedge Semiconductor Sympathy Correlation inside an NDX dispersion basket?
Treat the AI Semiconductor cluster (NVDA, AVGO, AMD, MU, AMAT, LRCX, KLAC, ASML) as a correlated sub-block by adding a short SMH (VanEck Semiconductor ETF) volatility overlay! That strips out shared AI-capex sympathy moves while keeping pure NVDA-vs-AMD market-share dispersion!
Publication record
- Published
- November 12, 2026
- Updated
- November 14, 2026
- Author
- Dr. Alistair Finch, CQF, FRM
- Review
- Review not recorded
- Automated fact check
- Passed in the stored pipeline record
- Source URLs
- 3 recorded
AI assistance recorded: anthropic/claude-opus-4.6. This field does not establish human review or source verification.
Academic & Institutional Attribution
Cite This Research & Embed Live Data Card
Standard academic & institutional research paper citation format.
Dr. Alistair Finch, CQF, FRM. (2026, November 14). Nasdaq-100 (NDX / VXN) Tech & Semiconductor Dispersion vs S&P 500. VolSurface Desk. https://volsurfacedesk.com/desk-notes/nasdaq-100-vxn-ai-semiconductor-tech-dispersion-premiaRelated Index Dispersion Correlation Desk & Institutional Briefings
Explore Index Dispersion Correlation Desk Hub (20) →Index Dispersion Correlation Desk
Implied Correlation, Index Dispersion Baskets & Earnings Vol Crush: Desk ManualIndex Dispersion Correlation Desk
Worst-of Basket Autocallable Notes: Structured-Product Correlation SupplyIndex Dispersion Correlation Desk
Ex-Dividend American Call Early-Exercise Traps in Equity DispersionIndex Dispersion Correlation Desk
Cross-Index Dispersion Arbitrage: S&P 500 (SPX) vs Russell 2000 & EURO STOXX 50Index Dispersion Correlation Desk
Intraday 0DTE & Weekly Friday Dispersion: Mega-Cap Gamma vs SPXWIndex Dispersion Correlation Desk
FINRA Rule 4210 TIMS & Prime-Broker Margin Netting on Equity DispersionIndex Dispersion Correlation Desk
M&A Merger Arbitrage Options: Pricing Bimodal Deal-Break W-Shaped SmilesIndex Dispersion Correlation Desk
Cboe COR1M & COR3M Implied Correlation Indices: Top-50 SPX Math & SignalsMarket Insights
Bitcoin holds $75K as AI regulation fears see KOSPI halted after 8% crashMarket Insights
US tech stock rout: is the AI bubble bursting?Regulatory Benchmarks
Listed Options, Futures & Volatility Derivatives Venues 2026 Licensing Benchmark: 6D Prudential Scorecard Across 72 Audited EntitiesCompliance Forensics
How to Verify Listed Options, Futures & Volatility Derivatives Venues Licences & Detect Clone Firms: 2026 Supervisory Lookup Playbook
VolSurface Desk Data, Benchmarks & Contributor Records
CC BY 4.0 Open Data
Open Institutional Datasets (CSV / JSON) →
Download desk-compiled quantitative series & schemas.
2026 Reference Matrix
2026 Institutional Benchmarks & Thresholds →
Statutory capital, clearing, margin & rate conventions.
Editorial Records
Authors & Review Records →
View named contributors where those records are available.
Complete Index
Master Research & Dossier Archive →
Browse all published briefings by topic pillar & date.