
Dealer Gamma Vanna Charm Flows
OCC STANS 20-Minute Intraday Risk Snapshots & 0DTE Margin Add-Ons
Explore how the Options Clearing Corporation (OCC) STANS methodology polices 0DTE systemic tail risk via 20-minute intraday portfolio snapshots, 10,000-path GARCH-Student-t simulations, and 1-hour intra-session margin calls.
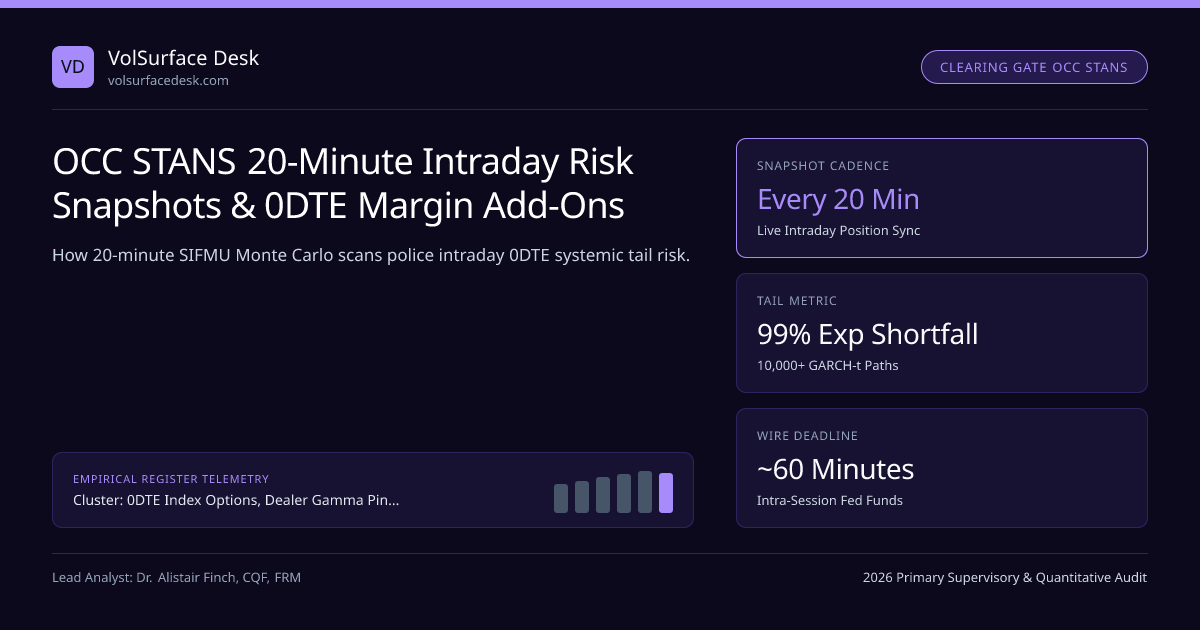
Behind every listed U.S. equity and index option traded on Cboe, Nasdaq, NYSE Arca, or MIAX stands a single central counterparty: the Options Clearing Corporation (OCC), regulated jointly by the SEC, CFTC, and the Federal Reserve as a Systemically Important Financial Market Utility (SIFMU). While retail traders talk casually about maintenance margin, institutional prime brokers and market makers live and die by OCC STANS (System for Theoretical Analysis and Numerical Simulations) (OCC STANS 20-Minute Intraday Risk Benchmark).
Within the 0DTE Index Options, Dealer Gamma Pinning, Vanna & Charm Rehedging silo and our 0DTE Dealer Gamma, Vanna & Charm Flows Guide, understanding STANS explains why afternoon short-gamma cascades abruptly accelerate around 13:30–14:30 ET when clearing-house risk thresholds trip forced buybacks.
Mathematical Architecture of OCC STANS: 99% Expected Shortfall + 0DTE Add-Ons#
Legacy broker margin systems evaluate worst-case loss across a handful of deterministic spot points. By contrast, STANS models joint underlying log-returns and 9-point implied-volatility-surface pivot factors using asymmetric GARCH(1,1) dynamics with heavy-tailed Student-t innovations (νdf ≈ 5 to 8 degrees of freedom), computing **2-day 99% Expected Shortfall (ES0.99)**:
- Expected Shortfall Definition: ES{0.99}(L) = (1 / 100) · Σ{m=1}^{100} L_{(m:10,000)} = average loss across the WORST 100 out of 10,000 full-revaluation Monte Carlo scenarios!
- 20-Minute Intraday Scan Loop (t_k = 09:50, 10:10, 10:30, ... ET): Re-ingests live clearing-member executed trades to prevent blind intraday 0DTE short-option buildup!
- Worked Intraday Margin Erosion Breach (Clearing Member Customer Book Sells 35,000 SPX 0DTE 5,790 Puts at 10:05 ET):
- At 10:10 ET (SPX = 5,850, IV = 12%): STANS ES0.99 = $148M. At 13:30 ET (SPX drops −0.85% to 5,800, IV jumps to 20%): GARCH conditional σt jumps +62% => STANS ES_0.99 surges to $412M (+$264M intraday deficit!), triggering a 60-minute Fedwire call!
Traders test portfolio stress sensitivities ahead of clearing scans using our Option Greeks & GEX Calculator and Black-Scholes Option Calculator.
OCC STANS 20-Minute Intraday Risk Surveillance & Margin Pipeline#
Why 0DTE Short Strangles Trigger Nonlinear GARCH Margin Jumps#
Notice a critical difference between static margin and GARCH-filtered STANS margin: in a GARCH(1,1) variance update ht = ω + α · r{t−1}2 + β · h_{t−1}, an intraday −1.5% S&P 500 drop accompanied by a Vomma vol-of-vol spike widens the distribution of all 10,000 simulated scenarios simultaneously! Thus, a clearing firm carrying customer short 0DTE strangles gets hit from three sides at once:
- Mark-to-Market Cash Erosion: Rising option marks directly reduce net liquidating equity.
- Gamma / Speed Migration: Spot slides closer to the short strike, pushing nonlinear Speed into the worst-1% tail scenarios.
- Pro-Cyclical Scenario Widening: Higher live VIX1D/VIX expands the STANS GARCH shock width!
Comparing OCC Clearing STANS vs Broker Customer Margin Regimes#
| Margin Layer & Authority | Methodology & Shock Horizon | Intraday Update Cadence | Treatment of Short 0DTE Tail Wings |
|---|---|---|---|
| OCC Clearing STANS (SEC / SIFMU) | 10,000-path GARCH Student-t 99% Expected Shortfall (2-day) | Every 20 minutes | Captures full nonlinear Vomma/Speed + concentration add-ons |
| Prime Broker House Stress | Custom TIMS + Spot/Vol stress matrix (±18% / +25v) | Real-time tick-by-tick | Auto-liquidates naked short 0DTE wings before OCC call hits |
| FINRA Rule 4210 TIMS PM | Deterministic 10-point grid (±15% broad index, ±12% ETF) | Real-time house overlay | Base TIMS misses vol-of-vol unless house stress added (see TIMS note) |
| Regulation T Strategy Margin | Formulaic % of underlying (20% − OTM + premium) | Trade-entry check | Over-margins hedged spreads; under-prices extreme tail ratios |
Intraday STANS Margin Escalation During a -1.5% SPX Selloff#
Crucially, institutional market makers who properly delta-hedge short SPX options with CME ES futures inside OCC–CME Cross-Margining accounts via Apex Futures or institutional FCMs offset ~80%–90% of first-order directional ES_0.99—confirming that STANS selectively penalizes unhedged directional and short-gamma speculators rather than hedged liquidity providers.
Frequently asked questions
How does OCC STANS differ mathematically from FINRA Rule 4210 TIMS portfolio margin?
TIMS evaluates static 10-point deterministic price slides (e.g., -15% to +15% on broad indices) using fixed implied volatility assumptions unless manually stressed. OCC STANS is a full 10,000-scenario multivariate GARCH Monte Carlo engine calculating 99% Expected Shortfall (tail average beyond 99% VaR) jointly across spot, skew, and vol-of-vol.
Why did 0DTE options force clearinghouses to adopt 20-minute intraday position snapshots?
Prior to 0DTE dominance, overnight open interest captured 95% of clearing risk because positions stayed on books for weeks. A 0DTE trader can open 50,000 short SPX puts at 09:45 ET and blow through a clearing broker’s capital by 13:30 ET without ever appearing in overnight OI!
How do OCC intraday margin calls transmit directly into S&P 500 afternoon liquidations?
When a clearing broker’s aggregate customer short-0DTE book triggers an OCC STANS intraday erosion alert at 13:40 ET, the broker’s automated risk desk immediately forces underlying accounts to buy back short 0DTE options or sell ES futures before the 1-hour settlement wire deadline.
Does OCC STANS charge concentration and liquidation add-ons for huge single-strike books?
Yes. Beyond baseline 99% Expected Shortfall, STANS applies Decorrelation, Implied-Vol Pivot, and Liquidation/Concentration add-ons whenever a clearing member’s vega or 0DTE gamma exceeds normal top-of-book market absorption capacity over a 2-day closeout horizon.
Publication record
- Published
- November 13, 2026
- Updated
- November 14, 2026
- Author
- Dr. Alistair Finch, CQF, FRM
- Review
- Review not recorded
- Automated fact check
- Passed in the stored pipeline record
- Source URLs
- 3 recorded
AI assistance recorded: anthropic/claude-opus-4.6. This field does not establish human review or source verification.
Academic & Institutional Attribution
Cite This Research & Embed Live Data Card
Standard academic & institutional research paper citation format.
Dr. Alistair Finch, CQF, FRM. (2026, November 14). OCC STANS 20-Minute Intraday Risk Snapshots & 0DTE Margin Add-Ons. VolSurface Desk. https://volsurfacedesk.com/desk-notes/occ-stans-20-minute-intraday-0dte-margin-addonsRelated Dealer Gamma Vanna Charm Flows & Institutional Briefings
Explore Dealer Gamma Vanna Charm Flows Hub (20) →Dealer Gamma Vanna Charm Flows
0DTE Index Options, Net Dealer Gamma (GEX), Vanna & Charm Rehedging Flows GuideDealer Gamma Vanna Charm Flows
FINRA Rule 4210 TIMS Portfolio Margin vs Reg T Haircuts for Index BooksDealer Gamma Vanna Charm Flows
Signed Dealer Gamma Reconstruction: Cboe Open-Close Data vs Naive OI GEXDealer Gamma Vanna Charm Flows
Monthly Third-Friday AM-Settled SPX OPEX & 09:30 ET SOQ Gamma UnwindsDealer Gamma Vanna Charm Flows
Overnight CME Globex ES & Cboe GTH Gamma Hedging Gaps Into 09:30 ET OpenDealer Gamma Vanna Charm Flows
Systematic Put-Write & Call-Overwrite ETFs (PUTW, XYLD, JEPI) Gamma SupplyDealer Gamma Vanna Charm Flows
Whalley-Wilmott Discrete Gamma Hedging Bandwidths Under ES Transaction CostsDealer Gamma Vanna Charm Flows
Single-Stock Call-Skew Inversion & Dealer Short-Call Gamma SqueezesVix Futures Variance Swap Convexity
Cross-Asset Spillover: CME SOFR Bachelier Swaption Vol & MOVE Into VIXVix Futures Variance Swap Convexity
Volatility Swaps vs Variance Swaps: Exact Vol-of-Vol Convexity PricingVix Futures Variance Swap Convexity
Leveraged & Inverse VIX ETPs (UVIX, SVIX): 16:00 ET TAS Rebalancing FlowsVix Futures Variance Swap Convexity
Cboe SKEW Index Above 150: Risk-Neutral Third Moment vs Crash Reality
VolSurface Desk Data, Benchmarks & Contributor Records
CC BY 4.0 Open Data
Open Institutional Datasets (CSV / JSON) →
Download desk-compiled quantitative series & schemas.
2026 Reference Matrix
2026 Institutional Benchmarks & Thresholds →
Statutory capital, clearing, margin & rate conventions.
Editorial Records
Authors & Review Records →
View named contributors where those records are available.
Complete Index
Master Research & Dossier Archive →
Browse all published briefings by topic pillar & date.