
Vix Futures Variance Swap Convexity
Cross-Asset Spillover: CME SOFR Bachelier Swaption Vol & MOVE Into VIX
Track cross-asset volatility contagion from CME SOFR Bachelier interest-rate swaption grids and Treasury MOVE into Cboe VIX: why fixed-income repo/duration shocks lead equity implied volatility by 3 to 10 sessions.
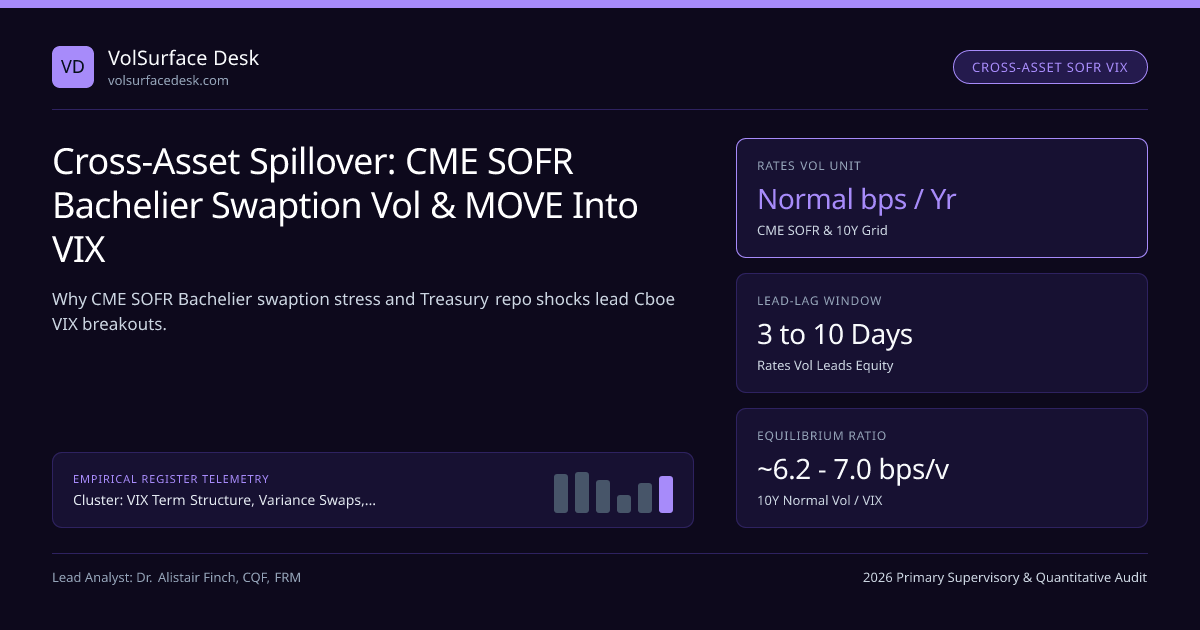
Equity-only traders are perpetually blindsided when a quiet S&P 500 session suddenly fractures into a −2.4% air-pocket despite zero corporate earnings misses. Cross-asset macro desks saw the warning flare five days earlier on the CME SOFR & Interest-Rate Swaption Normal Volatility Grid! Because U.S. Treasury repo funding and SOFR discount curves anchor every levered balance sheet on Wall Street, eruptions in Bachelier normal interest-rate volatility systematically spill over into Cboe VIX whenever stock-bond return correlation turns positive.
Within the VIX Term Structure, Variance Swaps, Vol-of-Vol VVIX & Tail Hedging silo and our VIX, Variance Swaps & Tail Hedging Guide, integrating CME rates volatility into VIX term-structure models eliminates single-asset blind spots.
Risk-Parity VaR Contagion and Cross-Asset Volatility Scaling Math#
Consider a $500B+ universe of volatility-targeting and risk-parity institutional portfolios holding weight wE in S&P 500 equities (vol σE) and weight wB in 10-year Treasury duration D10Y (yield normal vol σNrates, so bond price vol σB ≈ D10Y · σNrates). Portfolio variance depends critically on the stock-bond correlation ρ_{E,B}:
Quantitative Pricing Model: CME SOFR Swaption Vol & MOVE Spillover Into Equity VIX#
- Deflationary Regime (ρ{E,B} = −0.40): A jump in rates vol σN_rates is partially offset by negative cross-covariance!
- Inflation / Term-Premium Regime (ρ{E,B} = +0.48): A +30 bps jump in CME 10Y/SOFR normal vol spikes σport above VaR caps, forcing mechanical CME ES & SPX selling that drives VIX higher!
- Cross-Asset Z-Score Signal: Zspread = [ (σNSOFR − μR) / sR ] − [ (VIX − μV) / s_V ] > +1.75 SD warns equity vol is dangerously underpricing fixed-income stress!
- Worked Cross-Asset RV Sizing ($100k Equity Vega Target at VIX = 14.2 vs 3M CME 10Y/SOFR Vol = 124 bps [Z_spread = +2.1 SD]):
- Using empirical ratio 6.5 normal bps per 1.0 VIX point: Buy 100 Cboe VX2 ($100k/v) vs Sell $15,385/bp of 3M CME ZN/SOFR ATM Straddles—capturing +4.1 VIX-equiv points as dispersion closes!
Traders compare Bachelier vs Black-76 option sensitivities in our Black-Scholes Option Calculator and monitor SOFR carry impact on equity forwards in the Futures Fair Value Calculator.
Rates-to-Equity Volatility Contagion Pipeline (SOFR/MOVE → VIX)#
Comparing Fixed-Income vs Equity Volatility Benchmarks#
| Volatility Benchmark | Primary Exchange & Underlying | Quoting Convention & Typical Range | Role in Cross-Asset Volatility Book |
|---|---|---|---|
| CME SOFR Options / Swaptions | CME SR3 Options & OTC Swaptions | Normal Bachelier bps/yr (75 – 155 bps) | Front-end Fed policy path & banking funding stress |
| ICE BofA MOVE / CME 10Y (TYVIX) | 2Y/5Y/10Y/30Y Treasury Options | Normal Yield bps/yr (80 – 160 bps) | Duration term-premium & fiscal auction stress gauge |
| CDX IG / HY Credit Vol | Cleared Credit Index Options | Credit spread % / bps vol | Corporate balance-sheet bridge (Merton debt leg) |
| Cboe S&P 500 VIX | Cboe SPX Option Strip | Lognormal % / yr (12.0 – 35.0+) | Equity residual claim volatility (lags rates in inflation shocks!) |
10-Day Forward Cboe VIX Move by (SOFR/MOVE − VIX) Z-Score#
Look at the first bar (Z < −1.5: VIX spikes while SOFR/Treasury vol stays asleep!): that is an equally valuable reverse signal—when an isolated equity tech earnings miss spikes VIX to 23 while CME SOFR and CDX credit vol barely move, VIX backwardation fades twice as fast! Compare live parameters in Volatility Swaps vs Variance Swaps Convexity Wedge Guide.
Frequently asked questions
How do you compare CME SOFR Bachelier normal bps volatility against lognormal percentage Cboe VIX?
CME SOFR swaptions quote normal annualized basis-point volatility σ_N (e.g., 108 bps/yr), whereas VIX quotes percentage annualized equity volatility (e.g., 15.5%). Desks standardize both series into rolling 1-year Z-scores or divide MOVE/SOFR normal bps by 10Y duration-adjusted equity beta (~6.5 bps/vol pt)!
Why did interest-rate volatility (MOVE / SOFR vol) stay elevated in 2022–2024 even when VIX dropped to 12?
Three structural forces kept SOFR swaption vol high while equity VIX compressed: (1) Fed QT + massive Treasury issuance uncertainty, (2) Mortgage-Backed Securities (MBS) negative convexity hedging on rate swings, and (3) $120B+ of equity covered-call ETFs artificially pinning SPX realized vol!
Why does positive stock-bond return correlation amplify Rates-to-VIX spillover?
From 2000 to 2020, stock-bond correlation was negative (-0.35): falling yields cushioned equity drops. When inflation/term-premium shocks flip stock-bond correlation positive (+0.45), rising rate volatility directly inflates 60/40 and risk-parity portfolio VaR, forcing mechanical S&P 500 liquidation!
How do cross-asset volatility desks execute a "Buy VIX / Sell Rates Vol" relative-value switch?
When SOFR/Treasury vol spikes to +2.2 SD on a Fed/Treasury auction scare while VIX lags at -0.5 SD, macro desks sell 1M–3M CME SOFR / 10Y Treasury Note (ZN) straddles and buy vega-matched Cboe VX2 futures or SPX ATM straddles via CFTC-regulated FCMs.
Publication record
- Published
- November 13, 2026
- Updated
- November 14, 2026
- Author
- Dr. Alistair Finch, CQF, FRM
- Review
- Review not recorded
- Automated fact check
- Passed in the stored pipeline record
- Source URLs
- 3 recorded
AI assistance recorded: anthropic/claude-opus-4.6. This field does not establish human review or source verification.
Academic & Institutional Attribution
Cite This Research & Embed Live Data Card
Standard academic & institutional research paper citation format.
Dr. Alistair Finch, CQF, FRM. (2026, November 14). Cross-Asset Spillover: CME SOFR Bachelier Swaption Vol & MOVE Into VIX. VolSurface Desk. https://volsurfacedesk.com/desk-notes/cme-sofr-swaption-move-spillover-into-equity-vixRelated Vix Futures Variance Swap Convexity & Institutional Briefings
Explore Vix Futures Variance Swap Convexity Hub (20) →Vix Futures Variance Swap Convexity
VIX Term Structure, OTC Variance Swaps, VVIX Vol-of-Vol & Tail Hedging GuideVix Futures Variance Swap Convexity
Volatility Swaps vs Variance Swaps: Exact Vol-of-Vol Convexity PricingVix Futures Variance Swap Convexity
Leveraged & Inverse VIX ETPs (UVIX, SVIX): 16:00 ET TAS Rebalancing FlowsVix Futures Variance Swap Convexity
Cboe SKEW Index Above 150: Risk-Neutral Third Moment vs Crash RealityVix Futures Variance Swap Convexity
Forward-Starting Variance Swaps vs FVAs: Election & Macro Event CarryVix Futures Variance Swap Convexity
Spot-Weighted Gamma Swaps vs Variance Swaps: Taming Crash TruncationVix Futures Variance Swap Convexity
CFTC Traders in Financial Futures (TFF) VIX Positioning & Squeeze SignalsVix Futures Variance Swap Convexity
CFE & OCC VIX Futures–Options Cross-Margining & Capital OptimizationFX Risk Reversal Strangle Surfaces
Cross-Currency CIP Basis Swaps & FX Forward-Point Volatility in OptionsFX Risk Reversal Strangle Surfaces
Power Reverse Dual-Currency (PRDC) Notes & Long-Dated USD/JPY SkewFX Risk Reversal Strangle Surfaces
Garman-Kohlhagen Dual-OIS Curve Hedging: Domestic Rho & Foreign PhiFX Risk Reversal Strangle Surfaces
FX Variance Swaps vs Forward Volatility Agreements (FVAs) Desk Guide
VolSurface Desk Data, Benchmarks & Contributor Records
CC BY 4.0 Open Data
Open Institutional Datasets (CSV / JSON) →
Download desk-compiled quantitative series & schemas.
2026 Reference Matrix
2026 Institutional Benchmarks & Thresholds →
Statutory capital, clearing, margin & rate conventions.
Editorial Records
Authors & Review Records →
View named contributors where those records are available.
Complete Index
Master Research & Dossier Archive →
Browse all published briefings by topic pillar & date.